Understanding The Cost of An Employee

I would like nothing more than to see all employees, municipal and otherwise, paid in accordance with their value to the community as well as to the organization.

However, that would mean many if not most would be paid well above six-figures. Multiple times for many. That’s not just fire and police. That would include teachers. It would also include that water department worker who comes out at 2 am to fix a water main break when it’s 35 degrees outside with the wind blowing 25+ mph. But that’s just me dreaming and being in deep appreciation for those who watch over and take care of my needs. I was raised in a blue-collar home where it was believed and often said how grateful we should be for having a good, steady job.

There is also another view I take. From the finance viewpoint, those levels of pay would probably not be possible. Ever. Actually, that’s not my real hang up. I am guessing that most people reading this blog have never had to make a payroll out of their own pocket. I have. That’s a completely different world when payroll time comes around at an unbelievably quick pace irrespective of the money you’ve made since the past pay date.

Another point I can’t resist making is that if I am going to get things done through other people, I need them to be there. I’ve seen projects take months that should have been done in weeks. The reason is that it might take the expertise or decision-making skills of 4-5 people meeting together. That’s hard to do with vacations (up to 4-5 weeks!) and holidays and other leave. I have thought many times that if we can do without an employee being at work 9-10 weeks a year, we might be able to do without them for 52 weeks. I’m dead serious.

Let’s look at some of the arithmetic.

Fair warning! If you think I’m exaggerating, you are invited to run these numbers for your own employees. I hope you do.

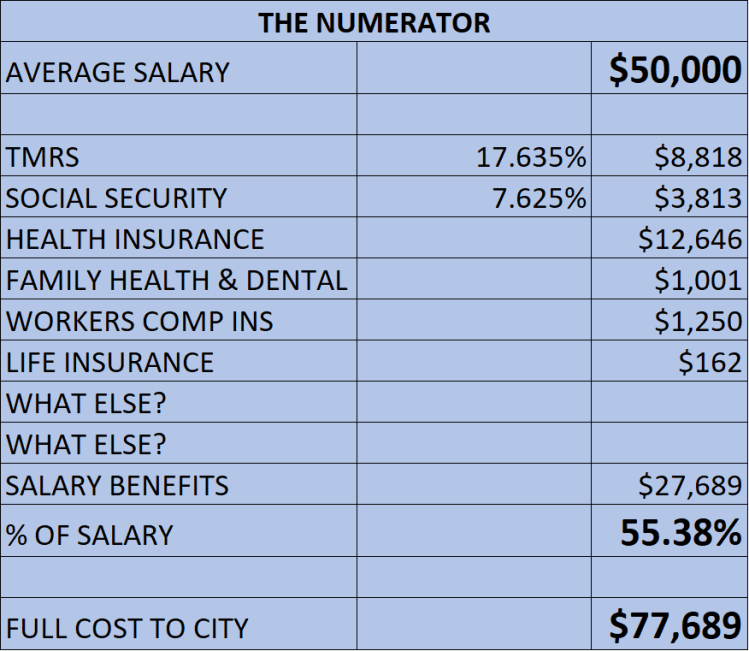
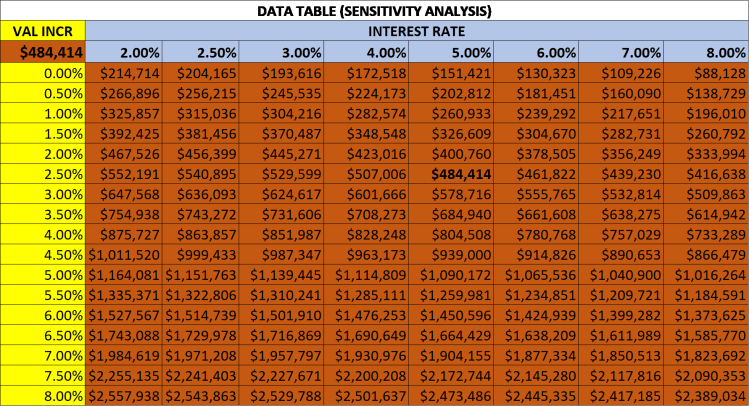
We tend to think of the base salary numbers as the cost of positions. However, depending on your circumstances and offerings, the table below shows how a $50,000 employee may actually cost you and taxpayers $77,689. That’s a 55.38% premium! Worse, most of the salary related costs are not visible to the employee. That’s your fault. Many cities prepare a statement of full costs to hand employees annually. Employees need to know and acknowledge they are aware of the money that is paid out of city bank accounts just for them.

Numerator

Now that we’ve reality-sized the Numerator, let’s look at the Denominator. Local governments are particularly prone to grant more time-off benefits. It doesn’t show up in the budget even though it should in the spirit of full disclosure. Again, let’s pay a $50,000 employee a total of $77,689 and then tell them their work is not all that critical so they can have more leave and paid to not show up. Sounds a little crazy to me.

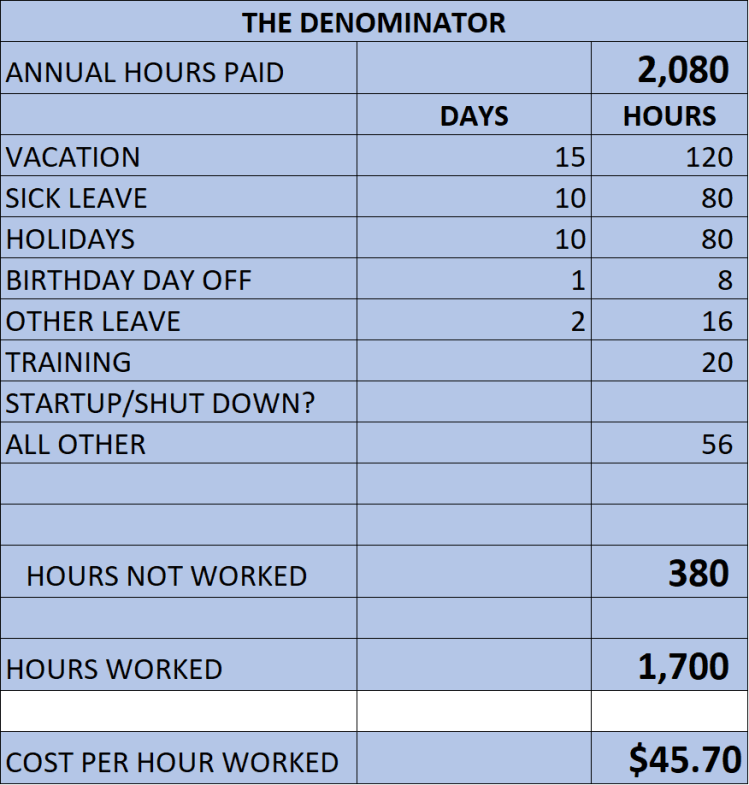
Most employees are paid for 52 weeks a year and 8 hours per day or 2,080 hours a year. Yet if we were to deduct for 3 weeks of vacation, 2 weeks of sick leave, 2 weeks worth of holidays and then add another 56 hours for everything else (training, TML, start-up and shut-down time, leaving early the eve of a holiday, etc), we can see how this could add up to about 380 hours off, leaving only 1,700 hours of presumed productivity. I generally use 1,800 hours as a benchmark. What is your hours worked by employee?

How can we preach efficiency and effectiveness and rah-rah about productivity with those kind of numbers? Hold off on your answers. I know them all, and some are legitimate and some aren’t.

The reality is that you could easily have a $50k employee that is costing the equivalent of $45.70 per hour.

Denominator

One More Day

I know, you want to break out singing the wonderful song from Les Miserables. Sorry, I can’t let you do that right now. Dang! Now it’s stuck in my head.

In order to dig a little deeper into the impact of giving employees just one more day off, I’ll pitch out my favorite illustration. Let’s say things are tight, and pay raises are flat. We’ve all been there. We offer employees their birthday off or a National Starbucks day off to stave off a palace revolt. Sounds good.

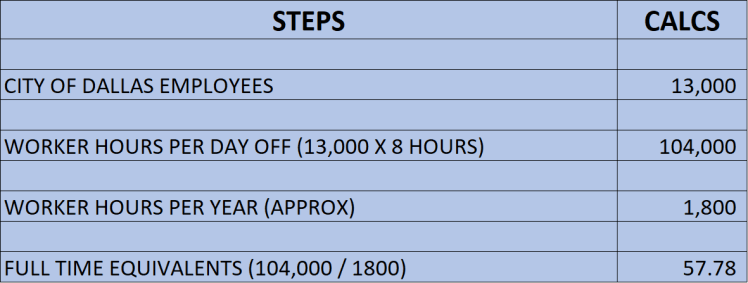
However, again, if we really give a flip about productivity, let’s paint the reality using the City of Dallas just to create a little drama. Even for Dallas, to instantly plop almost 58 new employees on the scene might cause a few tremors in the foundation of City Hall. Yet, that is exactly the productivity loss by the one-day gift. Do the math on your city. It’s about 0.44 employee per 100 you have now.

OneMoreDay

Those 24×7 Year-Round Jobs

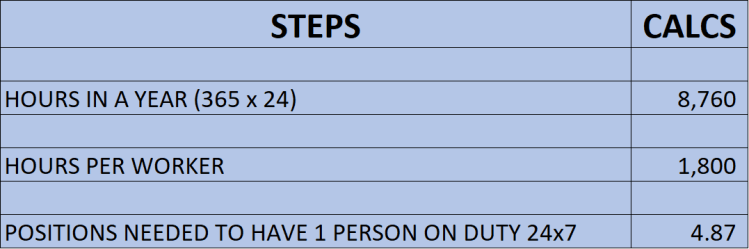
Lastly, let’s look at the impact of coverage for 24x7x365 positions usually found in public safety and a few other areas. In general, given holidays and vacations, it takes almost 5 positions to fill a single position 24x7x365.

Councils need to know these numbers. This is why the cost of a fire station isn’t the big deal. It’s what it costs to staff and equip the functions inside. A similar issue is where it takes a crew of 2-3+ to work on a sewer line. You don’t add 1 person only at a time.

24x7x365

Closing Thoughts

These are just the facts. If you are fretting over any of my individual comments or calculations, just chill. Dwell on the direction and thrust of this blog. I’m just wanting to increase the sensitivity to decisions that are costly and that are easy to grant and impossible to take back. It’s a genuine taxpayer inquiry, and you need to acknowledge that you understand the impact of these decisions, many of which aren’t actually discussed aloud in the public forum.

Employees are very, very expensive. The private sector knows this so well that they can’t move to robotics fast enough. If I can spend $77k x 4-5 worker to compare year-round productivity, and then perhaps look at a life span of a machine being 7 years (just playing with numbers), then I could spend $millions and save tens of $millions if the job could be automated.

But the most costly of municipal jobs aren’t conducive to robotics, right?

Hmmm! I’ll bet those were the very words from private sector workers a decade ago.

Here is my guess. If city management had to make payroll out of their own personal pockets, especially with a 2.5% cap on revenue producing opportunities, and maybe even a share of the cost-saving possibilities, we would see spectacular ideas implemented in a matter of a few years. LFM

Another Perspective on Infrastructure

I have been writing about and giving heads up about infrastructure needs since at least 1988. Nothing was mentioned much for years. In fact, when I went to the GFOAT Board at the time to request the topic be put on a conference program, nobody wanted to talk about it. Under the umbrella concern from finance folks that nobody was going to steal a street, it died. I was politely thanked and shown the door.

Since GASB was created, that particular Board eventually made a push to recognize Infrastructure cost. The general process for things like this in the governmental accounting world is to 1) don’t talk about it; 2) talk about it and measure it for informational purposes; 3) measure it but put it only in a footnote and 4); place it on the income statement and balance sheet. I wrote years ago that some cities are bankrupt and don’t know it. When assets turn into liabilities, it can wreck financial statements to make that most basic acknowledgment

The finance folks fought GASB at first, but we now about a dozen years of Infrastructure and especially the Depreciation numbers appearing in the CAFRs for the General Assets. In the footnotes. I am pretty certain that nobody has highlighted this information to their City Councils. That’s a shame. I often wonder how many City Managers even look at these numbers to put dollars to the gigantic investments in assets under their watch? When I started writing about Infrastructure that many cities may be bankrupt and not know it, I wasn’t kidding. Move that General Assets Depreciation number to your income statement and tell me how you look?

The picture gets worse when you realize the Assets of this nature are stated as historical costs only. And, get this, a huge portion of those assets weren’t built with city money anyway. They were built by developers and builders and then given to the city. To make matters worse, many of these development assets were built by cutting and digging through open corn fields without thousands of cars whizzing by. So, bottom line, the city gets to maintain, repair, rehab and replace with city money at today or future costs plus a premium for the time and danger to work in established traffic lanes at off-peak hours and weekends.

And worse, realize that all these assets are on a slow march to deterioration. Wait long enough, and the pace picks up. In 1990, while working on Impact Fees in Plano, the point was made about the very high percentage of their infrasture that had been built during the previous 15 years. Almost as quickly as the words were said aloud, the staff and consulting team realized that at some point in the future, there would be a bubble when those millions of miles of infrastructure would wear out in about the same short period. Ouch! BTW, that was 29 years ago. That bubble is here and has been here for a long time!

The Cost of Deferral

We are all familiar with the number one method of balance a budget – heck, just defer. Kick the can down the road, as the phrase goes. And that may just be one of the reasons some cities are so reluctant to do multi-year financial planning. Kick the imbalance to next year and … well, now that year and future years’ deficits just got deeper. If I were new to a council and discovered decades of decay had been shoved ahead for me to face, I would not be silent. I’d take care of the problem and show the tax rate spike that is a direct correlation to the malfeasance of neglect from councils in the past shoved ahead to my term. Why would I apologize, and why would I act surprised?

A Picture, Please!

The City of Carrollton provided an Infrastructure Report Card in 2011 and then updated the report in 2014 and 2018. It’s a must-read unless you don’t like to be bothered by future threats and sober reality. See https://www.cityofcarrollton.com/home/showdocument?id=13439.

Inside this report is a most fascinating diagram. I doubt that you need help understanding it. It is profound. You need to keep it in your hip pocket and pull it out as regularly as you show pictures of your kids or grandkids.

CarrolltonIllustration

Hit Me With Another Cheery Note, Lewis!

Thanks for giving me the permission to say everything again in another way.

I have found another helpful tool to easily obtain a statistic and a visual I’ve used several times doing a lot of manual work. This one is very useful and here is how it works. Go to your CAFR and pull out the number of miles of roadway in the Statistical Section. In my City of McKinney, it shows there are 802 miles of roads the City has to maintain. It also shows 960 miles of water mains and 713 miles of sanitary sewers. The last two are invisible – until they become visible, and then you’ve got a big problem.

Gee, that sounds like a lot, but look at my better way to say it offered here. If I were to draw a circle with a radius of 960, the picture below tells the fascinating story in a different and disturbing way. What would you expect from the Master Disturber?

Below is a circle with a 960-mile radius. That’s the picture of the assets for which you have been deputized to be the steward. That’s the “service area” stretched out in linearly. That’s the workload plan in some form or fashion.

I’ve driven these distances before (but not in every direction). You can have this sterile little statistic of 960 miles in a report. You might even say it verbally without it fully registering, especially if your staffers talk 100 mph without pausing when giving reports. All a yawner, perhaps. Try using a picture.

Hey, I’m just trying to help you tell a story. And as much as I love numbers, a picture is often much better. LFM

https://www.mapdevelopers.com/draw-circle-tool.php

Circle

Getting Taxed Out of Your Home? Prove it!

I find it interesting how anti-tax fanatics can camp on to a mantra and then start repeating it as truth. My fav is “People are getting taxed out of their homes.” The louder you cry it and the more emotional you get about it, the more it is accepted as the gospel, I guess.

I’d like to respond by saying “prove it!” Meaning, I don’t believe you. And if it is true, and you are over 65, then I’ve got a solution to offer. All I ask is that we talk with a little civility and respect on all sides. Well, I’ll match the responder’s tone.

Send me examples of people who are being taxed out of their homes. I will need their address. I will keep names and even the addresses confidential. But make no mistake about it, I will publish my findings.

Fire away.

For the Over-65ers

Meanwhile, I would like to respond to those over 65 this way: the state provides that you may not have to pay property taxes until you sell your home. You will eventually have to pay, and you will have to pay 5% simple interest.

The doubter and naysayer will likely respond incredulously to mean “won’t my estate may someday be in the hole?” Well, let’s examine that notion. To be as accurately as possible, I’m picking a home in my neighborhood so I can tie my calculations to a real tax bill.

The market value of the home is $419,198 (it could be any value). Let’s first address the issue of rising house values. That is the case here as shown below as the house value has increased from $212,883 in 1995 to $419,198. Holy Cow! That’s a 97% increase! Send up an Interceptor!

True. You could focus on that number alone and be mathematically correct if you wanted to be a warp-talker. But you could also compute the compounded growth rate over the 23-year period and learn that the actual annual rate is 2.99%. Gee, I hope the value has grown at least that much in my neighborhood.

MarketValue

So that means my tax bill has almost doubled, right? Not so fast. Never in history has my tax bill been based on the full market value. There have been generous discounts in the form of exemptions. In recent years, the owner turned 65, so the exemptions have grown in number and size. The actual base upon which the tax rates are applied are $332,936 for the City,  $302,597 for the County and about $251,000 for the School District and College District.

What’s more, the actual tax bill has been frozen for all but the City. Forever. Until the homeowner no longer lives there.

Now, let’s examine a scenario where tax bills in general are compared to home values in general. The combined tax rates for all four taxing jurisdictions equals $2.3772 per $100. Another way of understanding that number is to say property taxes equal 2.3772% of the home value. In other words, If a house value grows at 2.99% and the tax bill equals 2.38%, the homeowner may eventually get all City, County, ISD and College District taxes back when the house is sold – and then some.

The price of living in a full-service city, which benefits the homeowner, children and grandchildren, can be viewed in a different light. The emphasis on CAN BE is intentional. I may choose to be grateful for what I have. You may choose to complain. Your call.

Let’s understand the arithmetic by examining a sample:

Deferral

I’m taking my neighborhood example bill and situation and extending 25 years into the future. If the homeowner is 65, then this covers the scenario until the age of 90. One might safely assume the homeowner is no longer living in the homestead before then.

First, one might gasp that a deferred tax bill now about $6,500 annually can extend to just under $8,000 annually (due to the City taxes) in 25 years. You might equally be in disbelief that the home value could increase to $777,170. However, that is what happens when the home value grows at just 2.5% per year.

The exhibit shows the results USING THESE ASSUMPTIONS after 25 years. The deferred taxes totals $179,794.512. The accumulated interest on the deferred taxes equals $112,961.02 for a total of $292,756.14.

If the house were sold at that point for a price of $777,170, and the taxes and accrued interest paid off, there would still be equity in the home of $484,414.

What About Differing Assumptions?

I’m so glad you asked. This is when I go into my Excel teaching mode to show a feature just for this purpose. Let’s say you wanted to see what happens when the home value growth rate goes from 0% to 8% in 1/2% increments. You also wanted to see what happens if the state changed the interest rate to charge 2% to 8% in 1% increments. The interest rate was recently changed from 8% to 5%, so that assumption should be fixed for a number of years. But let’s see the results.

Boss, you just asked for 136 tables like the one above. Are you sure you want to see that many? And your response as a boss should be that you only want to see the results in the bottom line corner: What will be the remaining equity under these scenarios?

This is where a sensitity analysis (Data Table in Excel parlance) comes in. Here’s what you want to know once you understand the model above:

DataTable

As you can see, the net equity stays positive even if the house value growth increases were zero and the interest rate returned to 8%.

Other Issues

While you now have an alternative to offer those over 65 when they complain about taxes, there could be some hiccups. If they have a mortgage and the note holder balks, then this suggestion might not work. I can’t help you there other than to show them this blog.

Also, all of the air might be sucked out of the room by your city finance folks if this idea is suggested from the dias in a council meeting. There is a fear of losing revenue any time exemptions are discussed, and there should be. However, I have two responses. By the very nature of this legal solution, the tax deferrals are temporary. PLUS they pay 5%. If you have any kind of internal reserves to fund these deferrals, then compare 5% to the rate you are currently earning. Make it happen. Alternatively, my guess is that a local bank would be happy to be the financing party. Bottom line: it’s a legitimate concern with a legitimate answer.

There are already complaints that those NOT in need of this avenue of relief are taking advantage of the benefit. Sorry, I can’t help you there, either.

Conclusion

I live in a city where the mayor is way above average in smarts and heads above his peers when citizens come before the council making outlandish comments, mimicking the anti-tax mantras spoken in their ears. These naysayer robots are taken to task quite often and asked to explain in more depth. In other words, PROVE IT!

I am making an offer to my mayor as well as to your mayor and council. When you are bombarded with the “we’re being taxed out of our home,” get their address and send to me. I want to see the numbers, but I may also want to explore deeper. If they have lost their job or have huge medical bills, I want to point out that it’s not their taxes causing grief in their life. I will pray for them, but I won’t let them get away with inflammatory accusations about the cost of providing local government services.

LFM.

What Does a Recession Mean to Texas?

We generally don’t get hit as hard nor do we get hit in lockstep with the National Economy. But we are not immune to recessionary forces. And that is good.

You may think the flashing signs of a recession just happened overnight with interest rate inversions moving to the front burner this weekend. That is not the case. The yellow flag believed to be reliable is when the interest rates for the short-term government securities rise higher than the long-term. It’s a worry indicator. Why else would someone accept a lower interest for holding a 10-year government bond then for a 90-day T-Bill? It’s an inversion. We don’t like it when things are askew.

Our accepted correlation that a recession follows an interest rate inversion isn’t something dreamed up by economists. The chart below from the best source of government (and business) information is from the FRED, the Federal Reserve Economic Data site provided by the St Louis Fed. See http://www.fred.stlouisfed.org. They allow all of their graphics to have an overlay showing past recessionary periods.

Here you can see recession frequencie and durations. You can also see how the widest distance between these two investment instruments begins almost immediately when a recession is over and then goes into a slow decline until the point of inversion and another recession begins. So, the last recession ended in June 2009. As these rate differences zig and zag, they eventually move close together. But we’ve only had almost exactly 10 years to play Carnac the Magificant. (See https://en.wikipedia.org/wiki/Carnac_the_Magnificent). Hardly a magic trick or an academic secret.

Note, please, that we are way overdue for a recession. You might recall that for years the Federal Reserve has been manipulating the system with their toolbox of policies to stave off an inflation and keep employment high as long as possible. Recall, too, that economic cycles are part of a capitalistic system. We don’t like ugly, and job layoffs are as ugly as it gets, but that is part of wage management and pricing equilibrium. Beware when we allow our decision makers to abandon the Invisible Hand Theory. See https://economictimes.indiatimes.com/definition/invisible-hand. The penalty might prove to be severe in our future. But then, what do I know? I thought we were going to have the cataclysmic implosion in late 2007.

This inversion phenom is why you started hearing about the signal being flashed over the weekend and why you may likely hear it a lot more in coming weeks and months. The big worry is just how serious the stock market (another early indicator in most cases) might buy into this cautionary flag.

By the way, you should know that the powers at be declare a new recession well after it has actually started. The same goes for the end of a recession. The official finding comes many months after it is over. It takes some time for two sequential negative GDP quarters to be measured. Interesting, huh?

FredFed10YrVs3Month

Not To Worry – We’re The Great State of Texas!

Actually, that is a fact. We have buffers. We also have things in motion that don’t change directions quickly, like a huge cruise ship headed out of the gulf. Well, one in calm waters, anyway.

We’re insulated but not immune from turbulent waters and high winds. Fortunately, we have a two-month, not two-quarter, early-warning system. My sales tax chart below shows the rolling 12-month sales tax collections for local governments since the early 1990s. We busted through $9 billion annual collections (in the dark blue) with ease just a few months ago. Yet my favorite indicator is the percent change in the annual growth (in the red). I also marked the last two recessions on my chart this time.

The takeaways include that our sales tax collections locally have been slowing in the growth rate. That means we are increasing in dollars while decreasing in the rate of growth.

Can it go back up without going down any deeper? Yes, and that has happened many times. Is it natural to start declining? Yes, history shows that it is very difficult to grow at large rates and sustain that growth forever. In fact, you can see that almost every time we approached the upper boundary of the 1-STDev channel of about 10%, we pull back toward the statistical mean. That works in both directions.

Keep in mind that the overall average for the last three decades is about 5.93%. That’s not an accidental number. The average is the result of 1) population growth, 2) inflation, 3) the wealth factor as well as changes to the 4) sales tax rate and 5) base over this long period of time. If we averaged about 6% without the huge swings, we could describe that scenario as near to perfection as possible.

Also, please note how you could use the chart below to say with confidence that the Texas Local Government Sales Tax Collections may be able  to announce a national recession ahead of time with the red line AND YET we can safely say that we tend to lag the recessions by quite a few months. That may be a stretch, but this can be a compelling argument in light of historical data.

SalesTaxesAndRecessions

Conclusion

What are we to do with this information? First and foremost, just watch. If the rate inversion goes deeper and the sales tax growth rate decline continues and even accelerates, then we can confirm we are sliding into a recession.

It’s way overdue. Job-cut announcements started months ago and are increasing in frequency. In Texas, there is a huge business commitment in place that doesn’t stop overnight due to the inertia.

Take shelter mid-year? Not really unless we get slammed in a hurry? But FY 2020 might be facing a challenge.

Look ahead, but I offer you this challenge. Recessions have typically not lasted long (18-24 months). Please don’t make the mistake of start cutting back on things unnecessarily.

Why do you have those fund balance reserves? I would say it is to continue basic operations without cutting jobs that you will be hiring back not too long after the cuts. Provide those services, keep productive staff and don’t gut the programs.

And keep your hands off the dang libraries, ball fields and animal control!

Instill deep quarterly reviews of all revenues and expenditures with your staff. Announce to the rating agencies that programs are important or else they wouldn’t be there. A reduction in fund balances will be followed by a restoration to policy levels.

A Rainy Day Fund is meant to be used during these kinds of pullbacks.

In closing, a little jab. If you are waiting for a good recession to force yourself into making cuts you should be making every day as a manager, that’s cheap management. Just saying. LFM

Federal Deficits and Debt – What, Me Worry?

It’s been about 12 years since I started writing about this topic. Originally, I was kind of in a panic. I thought we were on the verge of something ugly happening any minute. Since then the problem has only grown worse – much more so. However, my mind has morphed into Clark Gable’s attitude toward Vivien Leigh. Frankly, my dear, Elvis is dead, and I don’t feel so good myself. Okay, my apologies, I stole part of that thought from Lewis Grizzard of the Atlanta Constitution (may he rest in peace), but I just love it!

When I first started following the US Debt and Deficit levels seriously, I was worried about me. Us. Then as time went on, and I knew my generation wouldn’t be able to ever pay it off, I started worrying about my grandchildren. They would have to pay for it. I no longer have that worry. The reason is that their generation and all future generations will never be able to pay off the US debt. And they shouldn’t.

Let me provide an update on my initial worry. The US Debt as of March 21, 2019 was $22,028,692,383,333.10 (https://www.treasurydirect.gov/NP/debt/current). It has ramped up quickly. The table below provides a glimpse of the speed and magnitude, the two critical metrics that typically predict when a Ponzi scheme is about to explode.

It took years for the US Debt to go from $5 to $6 trillion. Then we pass through the $7 to $9 trillion thresholds averaging 645 days each.  Then it got easy. We zoomed from $9 to $16 trillion in about 239 days each, the lowest being 167 days. From there we got from $16 to $20 trillion in 459 days each.

Sounds like we were “improving,” right? Not so fast, Citizen Oblivious. We leapt to $21 trillion in just 188 days, like a breeze blowing your hair in a convertible. And then for the most recent ceiling, we cross over $22 trillion in 333 days. Not even a year.

DebtDaysThreshold

How much is $22 trillion? There are so many ways to measure. Give me a few tries here. If that number were $1,000 bills, the stack would reach 1,495.7 miles into space. Still hard to see? How about we divide by the number of households as shown in the chart below. $22 trillion equals about $182,201.42 per US household. Staggering, huh? Would you like to write that check today or wait until payday?

Oh, I adjusted the historical dollars per household to today’s dollars just to show it’s well over a 5x jump since a 37-year-old was born. But I’ve got some better perspectives to show you, although your indigestion might get worse.

USDebt

How is the US Government paying interest on all that debt? Here’s where it gets real interesting. The annual interest costs alone (never mind the principal) has grown from $214.15 billion to $523.01 billion since just 1988. That’s bad, but you haven’t seen the worst part. The average interest rate in 1988 was 8.23%. It is now just over 2.40%.

Can you guess now why the Federal Government has been slowly moving debt from longer-term to shorter-term? Can you now see why the Federal Reserve has been artificially lowering short-term debt rates toward zero? Does it make sense now the panic from those in the know if inflation rises and interest rates do the same thing in lockstep? Did you really think all along that CPI numbers were true numbers when the methodology has changed many times over the last couple of decades, always resulting in a lower number?  (https://www.investopedia.com/articles/07/consumerpriceindex.asp)

USInterest

Here’s the best perspective yet. the US Debt is mostly the result of overspending. The chart below resembles a portion of Texas, but it is really the cumulative effect of the actual annual deficits when revenues exceed expenditures. Simple math. Devastating results. Since 1980, when deficits really starting climbing, the US Government has spent $13.808 trillion more than it has taken in. It doesn’t take long to dig a deep hole, does it?

Related, February 2019, the most recent monthly deficit, was $233,978,000. That is by far the largest single month EVER.

Deficits

Okay, here comes the Grand Finale on this topic. This is why the deficit is never going to go away, and why the debt levels will only grow toward Mars. Right now, if the US Government were forced to balance the budget, it would require a 28.07% revenue increase or expenditure cut to stop the bleeding.

Mind you, we would still have $22 million sitting there staring at us like the end of the malfunction scene in RoboCop when the errant machine was finished and sitting there smoking and the guys are yelling “don’t touch him,” speaking of the victim (Citizen Oblivious?). (https://www.youtube.com/watch?v=ZFvqDaFpXeM)

NeedToBalance

Conclusion

Holy Cow! How did we get here? Every president and every member of the Legislature has led us to this moment. And they are just responding to the Citizen Oblivious. Give it all to me, give it to me right now, and don’t make me pay for it. Hey, I’m in the second class of the Boomer’s.  I’m from the generation of What Me Worry? (https://en.wikipedia.org/wiki/Alfred_E._Neuman)

I was worried 12 years ago. Dangest thing I’d every seen. I doubt I’ll be here in 12 more years. Party on, Grandkids. We caused it. We knew it. We elected not to do a thing about it and voted in people to do out will, except to make it worse. LFM


A Huge Local Government Expense Not Being Disclosed

Hold off on shooting me with the GASB Gun for a minute. Let’s go back to Accounting 101. There is a principle that says you should not record the Net of items that should be separately disclosed. For instance, if you buy a big piece of equipment for $250,000 and get $25,000 for the trade-in or sale of the old piece of equipment, you shouldn’t record the piece of equipment at $225,000. There were two transactions or events. You record the piece of equipment for $250,000 and the sales or trade-in of the old piece of equipment at $25,000.

Two different pieces of information.

Another example where the separation is distinguished is with property tax collections. You record your property tax revenues as a revenue and the cost of tax collections as an expense: sound accounting with a focus on the expense side of things. If you netted the expense into the revenue, you might never see the cost of the contract.

You get a grant for police overtime and record the revenue separately from the overtime expense.

This is pure accounting logic.

Then We Fly Off The Cliff

The State Comptroller collects the sales taxes for every local government in the state. There are 1,658 Cities, Counties, Transit Districts and Special Districts. The Comptroller charges a “fee” of 2% for this service. In the fiscal year ending September 30, 2018, the fees collected totaled $183,421,882.77. One year!

So, please show me where any of the 1,658 entities are showing $183,421,882.77 in their budgets or audited financial statements. They are out of the spotlight. And so the years roll by with the expense amounts rolling up. The last 10 years alone, this expense has been $1,471,718,694.39.

Or to take a page out of the Legislative Playbook, accentuated with the obligatory gasp and deer-in-the-headlights look, Local Governments have paid a “fee” that has increased 53.9% in just 10 years. Where is the outrage?

Is This Really a Fee?

A service fee is supposed to bear some resemblance to the the cost of the service. A tax does not. So how much is the cost of service for collecting and distributing sales taxes to local governments? Well, that’s not easy to tell. You can take a look here in an attempt to find out. In all fairness, the cost of service (the numerator) should include all of the direct costs of collecting sales taxes plus administrative overhead and facility costs. Heck, it could even include some kind of return, a few percentage points.

But the denominator should be the 8.25% with 6.25% being borne by the state and 2.00% being paid by the Local Governments. If this is a fee.

The next logical test is that if Local Governments are being charged $183,421,882.77, then are there $756,615,266.43 ($183,421,882.77 / 2% x 8.25%) in sales tax collection costs involved here? I don’t see it in the link above. Not by a long shot.

So, Isn’t It Really a Tax?

Sure looks like it to me. And a huge one! Wow! Talking about ironies. This tax has increased 53.9% in the past ten years. It’s staggering and flies in the face of all the ultra-conservative rants about egregious spending.

What Should We Do?

From everything I can tell, State Comptroller Glenn Hegar is the fairest and most professional state elected official in Texas. In fact, I understand he is assembling local government officials to provide him with feedback on the sales tax processes October 10th in Austin. There should be a plea for him to put the service fee on a true fee basis. Ask him to conduct a cost of service study to show the full costs of collecting and distributing sales tax checks, including the audits.

Then allocation to Local Governments a 2.00% / 8.25% share.

The difference should be refunded to Local Governments.

Or there could be an alternative. Local Governments are spending $millions to hire consultants to find missing or mis-allocated sales taxes. In today’s GIS technology, there is no reason the Comptroller couldn’t provide detailed maps that show that every payer within the boundaries of a local government is being credited to the correct Local Government. It is insane to be paying $183,421,882.77 to the Comptroller and not be able to reduce the extra outside consultant expense of paying for zero-sum overall work. A consultant finds my money being paid to adjacent city, and then finds my city getting money from an adjacent city. That’s nuts.

There is so much more that the Comptroller could do. If a Local Government wants to see their confidential data, and have not requested the data in the past, they can only get the current calendar year plus the previous calendar year. They can’t even pay for the older data, although they could have more than ten years’ worth if they had requested all along. There simply is no excuse for not having access to that data given Local Governments paid the Comptroller $1,471,818,694.39 for services over the past ten years.

I also recommend that Local Governments record the money paid to the State Comptroller as an expense, along with a ten-year history in the Statistical Section of the CAFR. Okay, holster your GASB Gun, and just think through this sizable expense that nobody sees. It’s just not right. LFM


TOP 100 SERVICE FEE PAYERS
ENTITY FY 2018 LAST 10 FY
HOUSTON MTA $15,361,118.74 $128,778,118.43
HOUSTON $13,834,219.14 $119,675,201.80
DART $12,102,684.18 $96,457,914.20
SAN ANTONIO $7,123,770.08 $55,973,579.44
DALLAS $6,174,655.08 $50,817,283.63
AUSTIN MTA $4,912,997.85 $37,947,647.15
AUSTIN $4,501,162.52 $35,435,387.02
FORT WORTH $3,170,699.72 $25,015,008.73
SAN ANTONIO MTA $3,076,589.76 $24,641,435.31
ARLINGTON $2,219,554.11 $19,104,724.93
EL PASO $1,822,050.20 $15,694,629.71
PLANO $1,825,602.08 $14,654,342.83
CORPUS CHRISTI $1,601,425.38 $14,375,510.67
AMARILLO $1,556,903.62 $13,866,968.91
ROUND ROCK $1,652,458.97 $13,633,749.50
FRISCO $1,760,066.77 $12,449,367.34
FORT WORTH MTA $1,581,857.22 $12,234,380.67
LUBBOCK $1,423,145.53 $12,083,596.67
MCALLEN $1,256,629.69 $11,975,359.06
FORT WORTH CRIME CTRL DIST $1,498,063.00 $11,509,551.40
IRVING $1,368,553.42 $11,343,913.50
SAN ANTONIO ATD $1,393,679.69 $11,247,208.26
MIDLAND $1,343,112.17 $10,880,266.43
SUGAR LAND $1,064,268.06 $9,296,012.76
GRAND PRAIRIE $1,158,254.94 $9,060,253.59
EL PASO COUNTY $984,366.81 $8,419,147.39
MCKINNEY $1,090,433.95 $8,286,018.26
ABILENE $929,552.21 $8,076,564.57
ODESSA $1,333,220.96 $7,956,553.78
MESQUITE $895,256.60 $7,843,212.97
EL PASO CTD $897,755.60 $7,784,597.54
BEAUMONT $893,369.08 $7,708,526.39
TYLER $872,384.49 $7,702,418.21
GRAPEVINE $858,074.78 $7,617,770.02
LAREDO $847,208.61 $7,588,217.27
CONROE $983,471.07 $7,551,793.18
ECTOR CO HOSP DIST $1,055,593.34 $7,234,169.75
BROWNSVILLE $776,629.29 $6,992,229.32
MIDLAND COUNTY $1,135,900.69 $6,964,687.15
WACO $797,908.34 $6,638,438.31
ALLEN $807,651.79 $6,490,283.11
LONGVIEW $653,952.04 $6,189,432.57
CORPUS CHRISTI MTA $684,638.60 $6,058,247.70
LEWISVILLE $786,461.53 $6,025,063.44
WICHITA FALLS $639,148.79 $5,892,314.81
RICHARDSON $752,399.61 $5,885,538.19
PASADENA $693,306.84 $5,797,550.16
CARROLLTON $800,454.13 $5,711,078.50
COPPELL $781,511.52 $5,546,727.18
DENTON $748,902.86 $5,394,389.41
JEFFERSON COUNTY $614,518.93 $5,128,554.10
PEARLAND $671,736.32 $5,104,639.21
NEW BRAUNFELS $636,155.25 $4,972,018.84
SAN MARCOS $696,280.24 $4,884,031.36
SAN ANGELO $569,693.76 $4,861,878.87
VICTORIA $509,933.03 $4,846,560.21
GARLAND $581,891.15 $4,809,790.45
BRAZORIA COUNTY $683,020.36 $4,693,231.84
COLLEGE STATION $558,512.89 $4,591,624.75
THE WOODLANDS TOWNSHIP $566,894.72 $4,451,978.93
HARLINGEN $515,516.14 $4,319,363.18
DENTON CTA $568,921.08 $4,295,995.78
LOVING COUNTY $501,889.91 $4,167,991.23
KILLEEN $473,129.85 $4,142,585.33
SOUTHLAKE $585,815.19 $4,025,304.40
TEXAS CITY $461,344.06 $3,999,540.80
CEDAR PARK $583,660.03 $3,936,826.55
GEORGETOWN $523,324.40 $3,785,135.05
TEMPLE $443,364.36 $3,785,106.83
GALVESTON $427,354.93 $3,746,206.02
EDINBURG $450,221.71 $3,670,199.59
ROCKWALL $474,143.35 $3,637,845.13
MANSFIELD $467,429.37 $3,604,736.31
THE WOODLANDS TOWNSHIP EDZ $469,257.78 $3,601,842.03
SHERMAN $438,472.36 $3,546,488.54
SMITH COUNTY $373,708.72 $3,296,506.95
BELL COUNTY $391,111.34 $3,289,384.68
LEAGUE CITY $474,237.27 $3,283,983.43
BRYAN $406,889.80 $3,251,463.72
BAYTOWN $441,180.82 $3,196,052.66
WEBB COUNTY $345,070.07 $3,152,808.70
STAFFORD $339,895.96 $3,145,208.76
WEBSTER $359,497.34 $3,074,961.16
HURST $326,454.61 $3,063,773.43
GREGG COUNTY $316,354.01 $3,037,652.00
BURLESON $367,294.36 $3,032,756.95
MCLENNAN COUNTY $367,618.37 $2,981,097.38
TEXARKANA $332,270.03 $2,980,873.77
EULESS $367,093.16 $2,957,350.90
ROSENBERG $405,017.66 $2,935,111.20
THE COLONY $573,739.85 $2,917,157.71
MISSION $308,031.87 $2,916,947.54
PORT ARTHUR $314,769.35 $2,915,125.13
PHARR $372,817.34 $2,871,553.92
BRAZOS COUNTY $364,087.63 $2,834,916.46
HAYS COUNTY $417,860.60 $2,817,597.20
FLOWER MOUND $373,709.84 $2,768,979.25
NORTH RICHLAND HILLS $309,456.92 $2,739,693.78
FARMERS BRANCH $291,967.84 $2,709,455.24
CEDAR HILL $303,371.39 $2,668,111.18


Job Needed: Information Ombudsperson

Recently, I was telling a group of City Managers about a job description I wrote several years ago. An attendee asked to receive a copy, which I could not find, so here is my recollection. I hope to someday get all of my articles and essays moved to this blog site. Perhaps I can enlist a granddaughter to help in the future.

The job title, updated to reflect the times, came from me wanting to play off the Input/Output (I/O) computing term. However, the position is much more than IT even though I’d give a full 50% of the necessary skill set to computing sector.

Where do I suggest this position be placed? The Budget Office would be my first choice. This is where data should be directly married to management intellect. I believe the I/O could also be within the City Manager’s Office (CMO), probably reporting to an Assistant City Manager (ACM). Many ACMs reach the CMO via the Budget Office these days. And most City Managers, if honest, would say the ACM position is the best job in the House.

The I/O must be able to speak the language of management and to think like a manager. They must be politically savvy yet not be political. They should also be able to think like a crook.

The I/O must be able to transform operating data into management data. I’ve witnessed software systems being purchased over the last four decades on the basis, hope and promise of management data, analyses and reports. In fact, many if not most software systems produce operating data that in turn generate slightly higher level operating data. But not managerial data.

Operating data include registers, ledgers and details ad infinitum. Management data includes summaries, exceptions, graphical representations and the ability to slice and dice that information in multiple ways. Implied in the transformation of operating data into management data is the need to gobble tons of data in a way that makes sense such that the data can form the basis to support a decision.

Free to Stay in the Research & Development mode

If there is tragedy in data analysis, it is due to a lack of freedom to get into and stay in the R&D mode. If you try to use process people with a full plate to advance into data analytics, then forget it. Process people are budget analysts or accountants or just about anybody dedicated (or trapped) by operating cycles that allow no breathing room to think, explore and develop a skill-set. Even Project people with a full annual schedule of duties are unlikely to be able to take on and advance/excel in data analysis. And there is nothing worse than stop-start situations where one cannot remember where they left off once they pick up an old analysis effort.

The Tools

Obviously the first tool to reach full potential as a data analyst is Excel. To go way beyond basics, the I/O must master some of the more powerful features of Excel that can lead to super models and analyses. The first thing that might come to mind are the use of Excel micros. However, there are many more tools that need to precede macros, and I could make an argument that you can make quantum leaps in number crunching without macros.

The single most powerful tool in Excel is the ability to build pivot tables. This blog is not capable of focusing on the details of Excel features, but the easiest and most powerful tool is the ability to build a pivot table so that a large amount of data can be analyzed with built-in drill-down features to go from high summaries to the lowest detail with ease.

Excel can also import data from a number of sources, such as SQL Server. SQL is how most databases are constructed and stored for everything from your accounting and utility billing systems to building permitting.

However, it isn’t long before the capacity of Excel is challenged even though you can have 1 million rows and 15,000 columns of data in Excel. SQL Server has virtually no capacity limits. Along with database management, there are power SQL query and analytical tools. Yes, now you are stepping into computer program language territory, but one should not fear in light of the results one can get from SQL. However, you cannot dabble in that the skill-set comes with practice, practice, practice. I understand that some business schools and accounting programs now require multiple courses in SQL. There is a reason that is so. One leaps into a broad and powerful world of data analysis with SQL.

The Data Warehouse

Watch the face of your IT Manager when they learn you want to tap into “their” SQL databases. They have a right to be concerned, but they should not be if they are proactive. A tell-tale sign of assistance and cooperation is when you want a data analyst to have access to accounting and other data systems and get a roadblock as opposed to a suggestion to use a data warehouse. In essence, you want to be able to play with the data yet not touch the live systems. For instance, if you wanted to take a deep dive into your A/P system or your Utility Billing system, a data warehouse would include a download of the live system to a separate location as of the night before. Or it could be refreshed upon demand throughout the day. What’s the problem if I am not touching the live data?

Examples

I want to look at the details of our p-card spending by person by vendor for the past five years. I want an aging of our water meters, including the number of meters with over 1 million gallons of water in our system. How many batteries have been replaced in our fleet by vehicle over the past three years? How much overtime is being used in the past 10 years as employees approach retirement and might be spiking their pay? How much salary lag have we accumulated in the system so far this year? Are our water loss and unaccounted for numbers getting better or worse?

I can think of hundreds more, and you could, too.

The Danger Ahead

Several things have been happening over the past decade or so. More elected officials work for organizations where management data is derived from operating data and being made available to them in their operating and executive capacities. They often are appalled at the questions they want answers to that are met with, “we don’t know” or “we don’t have access to that information.” WHAT??? We have $millions invested in information systems and can’t get these logical questions answered?

If you haven’t noticed, the news media have been adding in-house talent or have been contracting with third-parties to analyze massive amounts of public data. So, they ask for a download of your utility bills or your check registers (already online) and then produce an exception report that is placed back into your hands as a story you should already know.

And the local complainers and watchdogs, many retired with analytical skills, can have a field day doing as I have explained.

Conclusion

In this day of forensic audits, you cannot be caught with someone outside your organization telling you something about your business you should already know. But this is not simply a plea for a defensive posture I am talking about here. It’s a plea for professional management.

I often open up a presentation with a statement like “while you are listening to me for the next few minutes, somebody is stealing from you this very minute.”

What I do know is that when something blows up, nobody gets thanked for the lean and mean staffing that also may equate to a lack of oversight where it should be.

But here’s the good news. Take one good analyst and give him or her three things. The right tool set; the authorization to explore any and all systems other than the confidential police data; and the time to be left alone to explore and build queries that can be run to look for exceptions.

I predict the payoff will be big. It will be in the form of trends you otherwise didn’t see happening or heads up to explore yellow flags. It wouldn’t be long before the organization fully realized that everything from operating statistics to revenue performance to spending is under healthy scrutiny. LFM


What Does This Troll Have to do with Managerial Problem Solving?


Troll

This Troll is located under a bridge in Seattle, Washington several miles from Bill & Melinda Gates’ $68 million home. I saw it on a bus tour on Saturday. It is visited night and day by kids, families and sightseers. How could you resist the invitation to go look for the troll hiding under a bridge? You can see the pedestrian bridges coming down both sides. That’s a full-size VW in his left hand. The hubcap resides in his left eye. There is a road in front of the troll to see it by driving under the bridge.

But this is end the of a story. Let’s work our way back to the beginning. The troll is the product of a neighborhood contest. A group was formed to come up with an artsy idea, and this was the result. A grant was provided to construct this attraction. Great idea, right?

Yet the motivation wasn’t to support the arts. The purpose of this troll was to solve a problem. A very ugly problem. This was the site for nightly drug use at the height of heroin addictions in Seattle. Police detectives were being called to this location almost nightly to deal with overdose problems. If detectives were called, then you know this was a death-related call – the kind that sends a team of people seeking the cause of death and another team seeking the drug dealer or murderer, either the direct or indirect cause of death.

Let’s Enumerate the Team

At the risk of stating the obvious, let’s count off the people who might be involved in just one case like this. I’m sure I’m leaving some group out, but this is from memory.

  1. Police call takers and dispatchers.
  2. Police patrol squad.
  3. Police Detective Investigators.
  4. EMS.
  5. Public Hospital Staff.
  6. City Morgue.
  7. Pauper Burials.
  8. Crime Scene and Crime Lab Personnel.
  9. Jail Facilities and Personnel.
  10. County Criminal Court Facilities & Staffing.
  11. District Criminal Court Judge and Administrative Clerks.
  12. Two Criminal Bailiffs for Court.
  13. Two Criminal Bailiffs for Criminal Transport.
  14. A Court Reporter.
  15. Two Criminal District Attorneys & Investigative Staffs.
  16. Two Court Appointed Defense Attorneys.
  17. The Jury Fees & Lost Time for Jurors.
  18. Expert Testimonies.
  19. Prison Facilities & Personnel for Decades, perhaps.
  20. Probation Officers & Support Staff.

Back when I was the Dallas County Budget Officer in my early career, I priced out the cost of just one trial. It was staggering back then, so I can only image the sticker shock today.

May I remind you that I mentioned the calls for overdoses and murders were routine. And it was just for this one location.

So, what if this wasn’t such an easy place to do drugs? Oh, and did I mention this problem in turn was creating a blighted area well beyond the spot in question as do all neglected areas where crime is left to move in?

That’s what the City in general and this neighborhood in particular wanted to address.

There is always the conventional alternative, and that is to keep adding costs triggered by one murder multiplying into 20 different areas of specialty – all at premium costs. Can you imagine the General Fund budgets for the City and County governments bloating up? Much worse, the money would grow as the problem grew, but not a thing would necessarily be done to solve the problem.

How do you stop that one murder from happening?

Lights, people and traffic motivated to come see an attraction was their answer. An investment instead of an expense. Hey, the protective shelter for Mr. Troll was already there! And imagine this – an art project investment turns into an economic development stimulator as the immediate area was reclaimed without corporate welfare!

Comments & Conclusion

If your first response is that all this did is to move the drug users and dealers to another location, then you have just revealed something about yourself. You are worthless as a problem solver.

Here is what I do know. The tax caps and cuts that are coming are real and will likely be severe, especially as they become cumulative over a period of a few years and then compounded by an economic downturn where real losses cannot be restored politically.

It’s. Going. To. Happen!

Here is a companion comment and a few questions. How many people working for you right now would be hired/re-hired today knowing what you know about them and their productivity right now? For each one of them, what are you doing to train/re-train, mentor, motivate, discipline or terminate? How many of them have 1 year’s of experience 20 times vs 20 years of continued growth in responsibility and contribution?

How many are good people, but they have just become way too expensive as the numerator has climbed with raises and generous benefits while the denominator has diminished with extra holidays, vacation days and sick leave days?

More than once in my career I have had city managers and department heads yelp like they had their legs chopped out from under them from a cutback – only to tell me privately that it was one of the best things that could have happened to make them step up to earn that part of their paycheck that includes making hard decisions they had been hesitating to make.

On The Other Hand

If your first response from the Troll story is that the demand side of your workload has got to be addressed, especially for services that require 24x7x365 coverage, then I apologize for scolding and only wish to provide encouragement.

I don’t like the way things are going with citizens and elected officials caring less about who gets hurt, that there is only one priority – cut taxes. I am working hard to provide analyses to show the fiscal impact for every city, county and school district in Texas. You should have already seen my report.

But you know what? They don’t care about facts. And I hear that nothing sets them off like being threatened with the consequences to public safety. I’ve even heard that one State Senator responds to that threat with “sometimes a few people may have to die.”

Here’s the deal. There are only a dozen or so ways to balance a budget. Improving Productivity is the first and Raising Property Taxes is last. LFM

Budget Balance Options

(I’m writing a more complete blog on these alternatives as soon as I can)

  1. Improve Productivity. $Impact: High.
  2. Defer Needed Spending (kick the can down the road, compounding costs) $Impact: High.
  3. Trim Expenditures. $Impact: Low.
  4. Reduce Program Service Levels. $Impact: Medium.
  5. Eliminate Programs Altogether. $Impact: Usually High.
  6. Don’t Start New Programs Requested by Citizens. $Impact: High.
  7. Refuse Unfunded Mandates. $Impact: Medium to High.
  8. Use One-Time Solutions (i.e. Reduce Reserves). $Impact: Medium.
  9. Shift the Burden (ie. To employees or another government). $Impact: Medium.
  10. Charge New Fees for Service. $Impact: Low to Medium.
  11. Increase Existing Fees for Services. $Impact: Low to Medium.
  12. Raise Property Taxes. $Impact: Medium to High.


The McKinney Elephant NOT in the Room

Let’s keep this simple:

  • Commercial and Industrial taxpayers cost less to serve than Residential.
  • The tax rates in cities that have a high Residential to Non-residential ratios are generally higher.
  • McKinney has a relatively high R:NR Ratio. And it has grown significantly higher in the last two decades as we have added many, many residential rooftops.
  • Just about everybody running for McKinney City Council in recent years have had a big plank in their platform acknowledging everything I’ve said up to this point AND pledging that they are going to do something about it to lower taxes.
  • Now comes the issue of raising the tax exemption for homeowners over 65 from a gigantic $60,000 to an even larger $65,000. Who can resist the opportunity to lower property taxes for the voting class, especially those over 65? Exactly nobody.
  • But here’s the catch. Every exemption for one taxpayer is a tax increase for another taxpayer. In most cases, the burden is added to the Non-Residential class + Apartments + Renters.

Watch the video from the Council meeting of June 19. Mayor Fuller tried to make the points outlined above. I don’t think he used the word “irony” in his comments, but that was the centrality of his message. The plea was to no avail. In the drama of a patriot explaining why he or she would die for their country, it was clear that most council members were going to vote to raise the exemption. So, Mayor Fuller makes the motion to approve the exemption increase himself. Good for him.

Where’s The Frigging Elephant in the Room?

There was not a single member of the business community there to explain the irony and the issue of making it attractive for businesses to come to McKinney. Wait, before you shoot me with the gospel gun, I know that there are many reasons for a business wanting to locate to any particular city. I can list them all. Fair treatment to the business community is just one of the signals that we want everybody to be part of the family here.

We spend a lot of money giving economic incentives to attract new businesses. Where was the McKinney Economic Development Corporation Board to at least make the points the Mayor was trying to make?

Thanks a lot big talkers who go to Chamber luncheons to make each other feel like you’re important and to talk about prosperity in McKinney. Thanks a lot MEDC for letting the Mayor twist in the wind while he was trying to keep a good balance between Residential and Business tax burden.

Oh, I forgot. You want somebody else to put their name and reputation on the line while you raise a glass to McKinney today and look only for opportunities to help YOU. If being on the MEDC Board is a stepping stone for being elected to the Council someday, why would you want to speak up for the McKinney headed for more imbalance in the decades ahead? The two-year vision you have while serving on the Board is quite revealing.

We stand behind you, Mayor! Waaaaayyyyy behind you. I expect there might have been a few from the Chamber or MEDC who called the Mayor after the meeting to pat him on the back for trying. You are of the most cowardly and selfish people walking the streets of McKinney.

Business Community, MEDC: you got what you deserved. And there will be more shifted to you in the future. The new guys will get incentives for coming. You will get shafted for staying quiet. LFM

Why Do We Wait for Animal Control to Reach a Crisis Before We Act?

Actually, I could have replaced “Animal Control” with a blank since this question applies to hundreds of situations in government.

But today I want to focus on just animal shelters in particular. As most of you know, I read from a few hundred (246 to be exact) Texas newspapers and their suburban editions each day. I look for stories that are of interest to city officials, city managers and mayors in particular.

I have known for decades that few topics consistently make the Top 5 as often as animal control issues. I live in McKinney, a city of 180,000 people, meaning just about that many people have an interest or downright big investment in pets.

In recent years, there is one common topic that pervades the Texas headlines. It is the overcrowding of animal shelters. On most days I can point you to at least 10 stories about animal shelters waiving fees and going to extra lengths to incentivize residents to make a permanent home for a pet in order to keep them from being euthanized, the ugly alternative.

While there are usually two primary ways to deal with challenges like animal control, programming and larger facilities, it is always programming that should be given resources even though that means physical space, too. Spay and neuter efforts are foremost, of course. That goes without saying. And adoption endeavors need a robust and unrelenting dedication from staff and volunteers.

But the facilities need to be sufficient, and that is where I want to place an emphasis with my comments today. My main point is to not be surprised at this need. I rarely go to our animal shelter or any shelter. The reason is simple. Although my wife and I have four pets, I am positive a visit for any reason would result in us adding to our fur family. But the last time I visited the Collin County Animal Shelter, it was organized chaos. I’m sure the pet inventory was over-crowded, but I had to work my way through the people (some bringing pets, some taking one home) and volunteers to talk to the person I went to see.

Here is what I was left wondering, and I think about this every time I read yet another “Code Red” adoption story across the state in my daily readings. Why would we not realize that the companion story to the daily rah-rah about Texas’ hyper-growth in population has the same direct correlation to animal population management?

To know that any city’s population that has grown 5-20% in the last five years, and is likely to be on that same path for many more years – and to not have an animal shelter program and facility expansion in lockstep – is to have one’s head stuck in the sand.

There was a new story in the Amarillo news media this morning. A dog in labor was euthanized. I’m having difficulty even imagining how that could happen. But I do know  there are some basic management principles at play. There is an intake rate and an outflow rate. When the former grows at levels that some would have no problem describing as “massive,” then the inventory (facility) can only expand so far until the outflows have to increase: Pets have to be adopted, shipped to another facility (shifting the burden) or else the animal has to be euthanized put to death.

But those inventory and processing steps – called animal shelter programming and facility capacity – need to be sized commensurate with the population growth. Otherwise, city and county leaders can expect mistakes and regretful decisions from staff and volunteers. To turn one’s back to this problem is irresponsible.

C’mon folks, these animal shelters need some help – and kind-hearted adopters who already have too many pets cannot be the only solution. LFM