The Professional Tea Party Distortionists Keep on Distorting!
Well, only one person took me up on my offer! It was for a school district. I started off thinking there was a discovery to be made that would be at odds with my expectations, but that was not the case.
Meanwhile, the Tea Party churned out a handful of distorted articles this week such as this one about Tarrant County. The headline reads “Tarrant County Proposes 9 Percent Tax Hike” while the sub-header reads “Tarrant County Commissioner’s proposed property tax rate would raise their average property tax bill 35 percent from just five years ago.”
Don’t miss the picture of the fat hog in the story. How elegant. And inflammatory. And intellectually dishonest. I can just hear the Tea Party Faithful slobbering a joyful yelp of approval. We now know where carnival barkers go when they retire.
Then comes their aha moment. The Average Tax Bill has gone from $348.38 to $512.11 as the Average Taxable Single Family Value has grown from $131,962 to $218,850 in 2019. Woo-hoo! Isn’t that criminal?
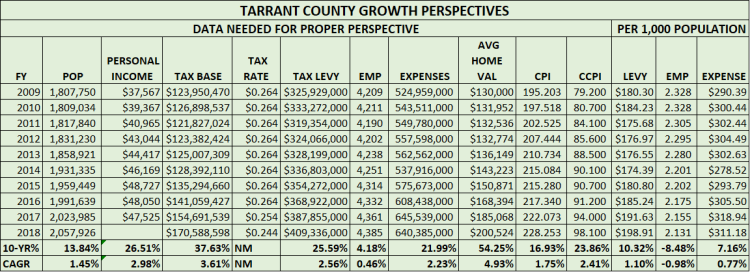
Wait a minute! Let’s be fair. I don’t work for Tarrant County nor do I know anybody in government there as far as I know. I just want to look at facts and encourage you to do the same. Here’s my take from the table below. Most of the data is from the statistical section of their FY 2018 CAFR.
Population drives everything! I see that Tarrant County’s population has grown from 1,807,750 to 2,057,926 from FY 2009-2018. That’s 250,176 more people to serve. That’s huge by any yardstick you want to use. But instead of showing off with the total 13.84% like the Tea Party is prone to do, the Compounded Annual Growth Rate (CAGR) of 1.45% is a more fair way to provide a perspective.
Personal Income (2018 values weren’t available) shows an increase of 2.98%, over double the population growth. That’s good. Bond rating agencies look for both ability to pay and willingness to pay. Only the Tea Party could take a healthy financial statistic and turn it into a demonic story. And few even know or acknowledge that the voters are very important, but so are the invisible bondholders (you really don’t want them to become visible!) that have invested over $300 million in TC bonds and over $9 billion for all local government entities in TC.
The Tax Base has grown by 3.61% and the Tax Rate has decreased, but the most important number is the combination of the two, the Tax Levy. That metric has grown at 2.56%. Given that the CPI has grown at 1.75%, the 2.56% appears fairly reasonable. More on that later.
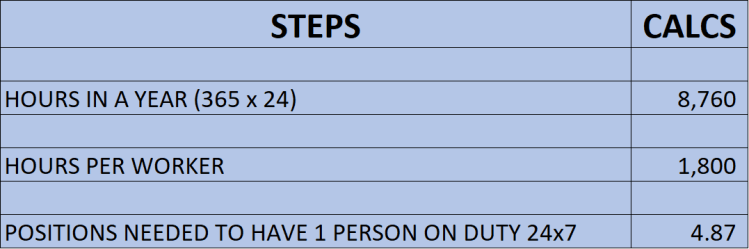
TC has grown from 4,209 employees to 4,385 for the period I’m analyzing. Even in total numbers, that seems reasonable, but it will look even better when put in the proper perspective as I will do shortly.
Total spending (“Tax & Spend, Tax & Spend” in Tea Party jargon), rose from $524,959,000.00 to $640,685,000.00 (add the pennies to make it look scarier) boils down to a CAGR of 2.23%. Again, when adjusted for CPI of 1.75%, what is your conclusion? If you want to be fair.
Now let’s hone in on some of these key metrics when placed on a per 1,000 population basis. The Tax Levy has grown at a CAGR of 1.10%. The number of employees have actually dropped from 2.328 to 2.131. Imagine that! The total expenses have only risen by 0.77%, which means it has actually declined when adjusted for CPI.
I don’t see a single mention of any of these facts in the Tea Party story. It’s being portrayed as journalism. Yeah, I know. Just wanted to get a laugh out of you.
Oh wait, you thought I had forgotten about those outrageous Average Home Values. No way.
That statistic has risen by 54.25% or 4.93% CAGR. Big? Yes. Distorted? Yes, too. Let me explain why.
While CPI averages 1.75%, the more appropriate construction index is significantly higher at 2.41% annually. But that’s only part of the story.
What isn’t shown is the average size of the single family home. I don’t know that square footage number, but I do know that it has grown over the years.
But the bigger untold story is that these numbers tend to grow because new homes are being added to an existing base. I’m pretty sure that the average TC single family home was built somewhere in the 1970s or early 1980s at best. Yes, this makes the existing homes more valuable, but not to the level of new construction.
In other words, the more TC grows, the more the average single family home value is going to grow since each year adds then-current values to an older base. Look far enough into the future, and you will conclude that the average home will be $300,000 before long, and then $400,000.
And with the North Texas Area growing by 1,000,000 people every 7-8 years, the Tea Party, unable to grasp big numbers as anything other than bad, will have a field day. It’s kind of sad when incendiary statements can be fabricated from nothing more than the size of numbers that may be difficult to place into perspective.
Most people would view that increasing value as good. But the Tea Party makes it look as bad as they possibly can, completely ignorant to natural (and desired) growth in value. I don’t hear anybody complaining that they bought a house at $50,000 some time ago, and now it can be sold for $150,000.
Conclusion
The Tea Party is capitalizing on fear and distorted numbers that make them lock into a “gotcha” mode to inflame their followers. They are doing a disservice to society. They take no responsibility for having any other value in life. Cloaked in self-righteous patriotic armor, they are misleading the public as they validate their purpose by misrepresenting the perspective that more responsible government officials know is simply wrong.
I’ll renew my offer to the Tea Party. Let’s sit down and deal with all the facts with the goal of telling the most accurate and complete story possible. You claim to be all about transparency while demonstrating an obvious opaqueness. I’m calling you out and hope others will do the same. LFM


You must be logged in to post a comment.