Getting Taxed Out of Your Home? Prove it!

I find it interesting how anti-tax fanatics can camp on to a mantra and then start repeating it as truth. My fav is “People are getting taxed out of their homes.” The louder you cry it and the more emotional you get about it, the more it is accepted as the gospel, I guess.

I’d like to respond by saying “prove it!” Meaning, I don’t believe you. And if it is true, and you are over 65, then I’ve got a solution to offer. All I ask is that we talk with a little civility and respect on all sides. Well, I’ll match the responder’s tone.

Send me examples of people who are being taxed out of their homes. I will need their address. I will keep names and even the addresses confidential. But make no mistake about it, I will publish my findings.

Fire away.

For the Over-65ers

Meanwhile, I would like to respond to those over 65 this way: the state provides that you may not have to pay property taxes until you sell your home. You will eventually have to pay, and you will have to pay 5% simple interest.

The doubter and naysayer will likely respond incredulously to mean “won’t my estate may someday be in the hole?” Well, let’s examine that notion. To be as accurately as possible, I’m picking a home in my neighborhood so I can tie my calculations to a real tax bill.

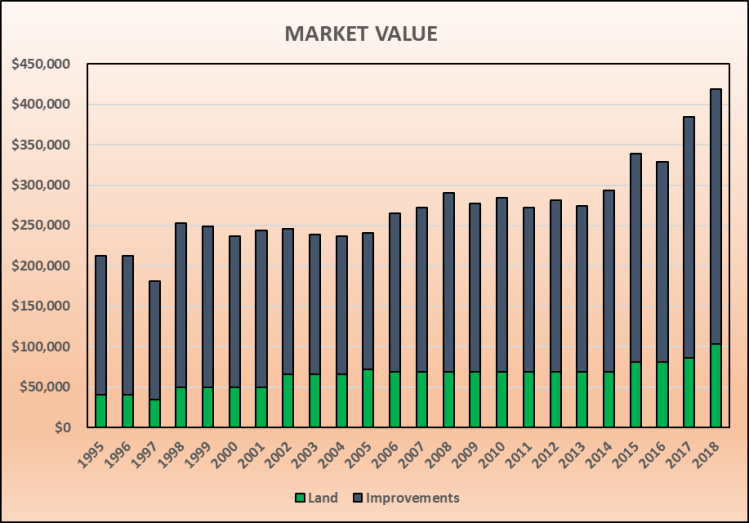
The market value of the home is $419,198 (it could be any value). Let’s first address the issue of rising house values. That is the case here as shown below as the house value has increased from $212,883 in 1995 to $419,198. Holy Cow! That’s a 97% increase! Send up an Interceptor!

True. You could focus on that number alone and be mathematically correct if you wanted to be a warp-talker. But you could also compute the compounded growth rate over the 23-year period and learn that the actual annual rate is 2.99%. Gee, I hope the value has grown at least that much in my neighborhood.

MarketValue

So that means my tax bill has almost doubled, right? Not so fast. Never in history has my tax bill been based on the full market value. There have been generous discounts in the form of exemptions. In recent years, the owner turned 65, so the exemptions have grown in number and size. The actual base upon which the tax rates are applied are $332,936 for the City,  $302,597 for the County and about $251,000 for the School District and College District.

What’s more, the actual tax bill has been frozen for all but the City. Forever. Until the homeowner no longer lives there.

Now, let’s examine a scenario where tax bills in general are compared to home values in general. The combined tax rates for all four taxing jurisdictions equals $2.3772 per $100. Another way of understanding that number is to say property taxes equal 2.3772% of the home value. In other words, If a house value grows at 2.99% and the tax bill equals 2.38%, the homeowner may eventually get all City, County, ISD and College District taxes back when the house is sold – and then some.

The price of living in a full-service city, which benefits the homeowner, children and grandchildren, can be viewed in a different light. The emphasis on CAN BE is intentional. I may choose to be grateful for what I have. You may choose to complain. Your call.

Let’s understand the arithmetic by examining a sample:

Deferral

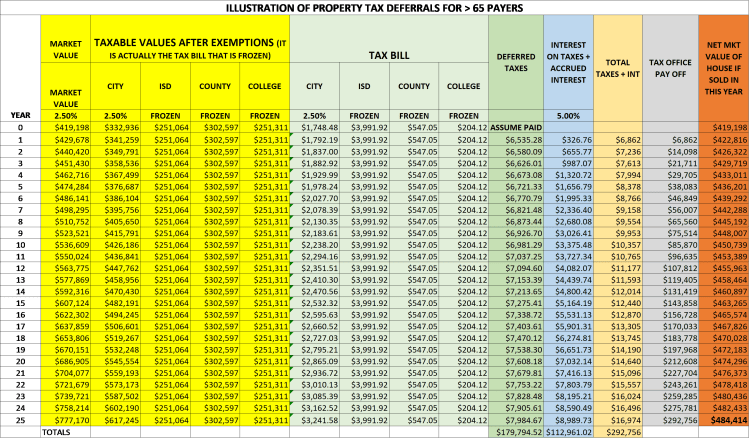
I’m taking my neighborhood example bill and situation and extending 25 years into the future. If the homeowner is 65, then this covers the scenario until the age of 90. One might safely assume the homeowner is no longer living in the homestead before then.

First, one might gasp that a deferred tax bill now about $6,500 annually can extend to just under $8,000 annually (due to the City taxes) in 25 years. You might equally be in disbelief that the home value could increase to $777,170. However, that is what happens when the home value grows at just 2.5% per year.

The exhibit shows the results USING THESE ASSUMPTIONS after 25 years. The deferred taxes totals $179,794.512. The accumulated interest on the deferred taxes equals $112,961.02 for a total of $292,756.14.

If the house were sold at that point for a price of $777,170, and the taxes and accrued interest paid off, there would still be equity in the home of $484,414.

What About Differing Assumptions?

I’m so glad you asked. This is when I go into my Excel teaching mode to show a feature just for this purpose. Let’s say you wanted to see what happens when the home value growth rate goes from 0% to 8% in 1/2% increments. You also wanted to see what happens if the state changed the interest rate to charge 2% to 8% in 1% increments. The interest rate was recently changed from 8% to 5%, so that assumption should be fixed for a number of years. But let’s see the results.

Boss, you just asked for 136 tables like the one above. Are you sure you want to see that many? And your response as a boss should be that you only want to see the results in the bottom line corner: What will be the remaining equity under these scenarios?

This is where a sensitity analysis (Data Table in Excel parlance) comes in. Here’s what you want to know once you understand the model above:

DataTable

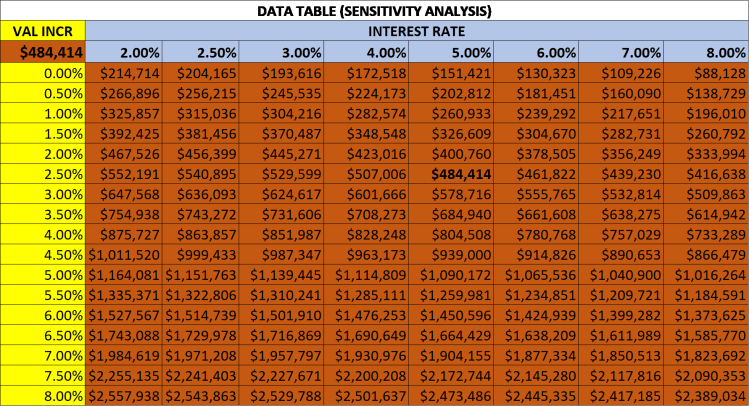
As you can see, the net equity stays positive even if the house value growth increases were zero and the interest rate returned to 8%.

Other Issues

While you now have an alternative to offer those over 65 when they complain about taxes, there could be some hiccups. If they have a mortgage and the note holder balks, then this suggestion might not work. I can’t help you there other than to show them this blog.

Also, all of the air might be sucked out of the room by your city finance folks if this idea is suggested from the dias in a council meeting. There is a fear of losing revenue any time exemptions are discussed, and there should be. However, I have two responses. By the very nature of this legal solution, the tax deferrals are temporary. PLUS they pay 5%. If you have any kind of internal reserves to fund these deferrals, then compare 5% to the rate you are currently earning. Make it happen. Alternatively, my guess is that a local bank would be happy to be the financing party. Bottom line: it’s a legitimate concern with a legitimate answer.

There are already complaints that those NOT in need of this avenue of relief are taking advantage of the benefit. Sorry, I can’t help you there, either.

Conclusion

I live in a city where the mayor is way above average in smarts and heads above his peers when citizens come before the council making outlandish comments, mimicking the anti-tax mantras spoken in their ears. These naysayer robots are taken to task quite often and asked to explain in more depth. In other words, PROVE IT!

I am making an offer to my mayor as well as to your mayor and council. When you are bombarded with the “we’re being taxed out of our home,” get their address and send to me. I want to see the numbers, but I may also want to explore deeper. If they have lost their job or have huge medical bills, I want to point out that it’s not their taxes causing grief in their life. I will pray for them, but I won’t let them get away with inflammatory accusations about the cost of providing local government services.

LFM.

Job Needed: Information Ombudsperson

Recently, I was telling a group of City Managers about a job description I wrote several years ago. An attendee asked to receive a copy, which I could not find, so here is my recollection. I hope to someday get all of my articles and essays moved to this blog site. Perhaps I can enlist a granddaughter to help in the future.

The job title, updated to reflect the times, came from me wanting to play off the Input/Output (I/O) computing term. However, the position is much more than IT even though I’d give a full 50% of the necessary skill set to computing sector.

Where do I suggest this position be placed? The Budget Office would be my first choice. This is where data should be directly married to management intellect. I believe the I/O could also be within the City Manager’s Office (CMO), probably reporting to an Assistant City Manager (ACM). Many ACMs reach the CMO via the Budget Office these days. And most City Managers, if honest, would say the ACM position is the best job in the House.

The I/O must be able to speak the language of management and to think like a manager. They must be politically savvy yet not be political. They should also be able to think like a crook.

The I/O must be able to transform operating data into management data. I’ve witnessed software systems being purchased over the last four decades on the basis, hope and promise of management data, analyses and reports. In fact, many if not most software systems produce operating data that in turn generate slightly higher level operating data. But not managerial data.

Operating data include registers, ledgers and details ad infinitum. Management data includes summaries, exceptions, graphical representations and the ability to slice and dice that information in multiple ways. Implied in the transformation of operating data into management data is the need to gobble tons of data in a way that makes sense such that the data can form the basis to support a decision.

Free to Stay in the Research & Development mode

If there is tragedy in data analysis, it is due to a lack of freedom to get into and stay in the R&D mode. If you try to use process people with a full plate to advance into data analytics, then forget it. Process people are budget analysts or accountants or just about anybody dedicated (or trapped) by operating cycles that allow no breathing room to think, explore and develop a skill-set. Even Project people with a full annual schedule of duties are unlikely to be able to take on and advance/excel in data analysis. And there is nothing worse than stop-start situations where one cannot remember where they left off once they pick up an old analysis effort.

The Tools

Obviously the first tool to reach full potential as a data analyst is Excel. To go way beyond basics, the I/O must master some of the more powerful features of Excel that can lead to super models and analyses. The first thing that might come to mind are the use of Excel micros. However, there are many more tools that need to precede macros, and I could make an argument that you can make quantum leaps in number crunching without macros.

The single most powerful tool in Excel is the ability to build pivot tables. This blog is not capable of focusing on the details of Excel features, but the easiest and most powerful tool is the ability to build a pivot table so that a large amount of data can be analyzed with built-in drill-down features to go from high summaries to the lowest detail with ease.

Excel can also import data from a number of sources, such as SQL Server. SQL is how most databases are constructed and stored for everything from your accounting and utility billing systems to building permitting.

However, it isn’t long before the capacity of Excel is challenged even though you can have 1 million rows and 15,000 columns of data in Excel. SQL Server has virtually no capacity limits. Along with database management, there are power SQL query and analytical tools. Yes, now you are stepping into computer program language territory, but one should not fear in light of the results one can get from SQL. However, you cannot dabble in that the skill-set comes with practice, practice, practice. I understand that some business schools and accounting programs now require multiple courses in SQL. There is a reason that is so. One leaps into a broad and powerful world of data analysis with SQL.

The Data Warehouse

Watch the face of your IT Manager when they learn you want to tap into “their” SQL databases. They have a right to be concerned, but they should not be if they are proactive. A tell-tale sign of assistance and cooperation is when you want a data analyst to have access to accounting and other data systems and get a roadblock as opposed to a suggestion to use a data warehouse. In essence, you want to be able to play with the data yet not touch the live systems. For instance, if you wanted to take a deep dive into your A/P system or your Utility Billing system, a data warehouse would include a download of the live system to a separate location as of the night before. Or it could be refreshed upon demand throughout the day. What’s the problem if I am not touching the live data?

Examples

I want to look at the details of our p-card spending by person by vendor for the past five years. I want an aging of our water meters, including the number of meters with over 1 million gallons of water in our system. How many batteries have been replaced in our fleet by vehicle over the past three years? How much overtime is being used in the past 10 years as employees approach retirement and might be spiking their pay? How much salary lag have we accumulated in the system so far this year? Are our water loss and unaccounted for numbers getting better or worse?

I can think of hundreds more, and you could, too.

The Danger Ahead

Several things have been happening over the past decade or so. More elected officials work for organizations where management data is derived from operating data and being made available to them in their operating and executive capacities. They often are appalled at the questions they want answers to that are met with, “we don’t know” or “we don’t have access to that information.” WHAT??? We have $millions invested in information systems and can’t get these logical questions answered?

If you haven’t noticed, the news media have been adding in-house talent or have been contracting with third-parties to analyze massive amounts of public data. So, they ask for a download of your utility bills or your check registers (already online) and then produce an exception report that is placed back into your hands as a story you should already know.

And the local complainers and watchdogs, many retired with analytical skills, can have a field day doing as I have explained.

Conclusion

In this day of forensic audits, you cannot be caught with someone outside your organization telling you something about your business you should already know. But this is not simply a plea for a defensive posture I am talking about here. It’s a plea for professional management.

I often open up a presentation with a statement like “while you are listening to me for the next few minutes, somebody is stealing from you this very minute.”

What I do know is that when something blows up, nobody gets thanked for the lean and mean staffing that also may equate to a lack of oversight where it should be.

But here’s the good news. Take one good analyst and give him or her three things. The right tool set; the authorization to explore any and all systems other than the confidential police data; and the time to be left alone to explore and build queries that can be run to look for exceptions.

I predict the payoff will be big. It will be in the form of trends you otherwise didn’t see happening or heads up to explore yellow flags. It wouldn’t be long before the organization fully realized that everything from operating statistics to revenue performance to spending is under healthy scrutiny. LFM


Will The Real Population Numbers Please Stand Up!

Dear Santa:

All I want for Christmas is a good clean set of official population estimates by year. From one official source. I know. I said by year, but it’s not that easy. Population numbers “by year” come in at least four flavors. As of April for Census purposes. As of July for intra-census years. By fiscal year that usually begins in October. And let’s not forgot the good old calendar year! Oh my. I just don’t care. Just make all of the “years” be consistent, please.

Is there a way, Santa, for it to be against the law for any agency to put out population estimates except for the one designated and blessed by you, and only you, to be the official estimator? Also, is there any way that you could require that central agency to let the city officials see the estimates first. Or better yet, have the city submit their estimates and the basis for their estimates to the official high order of population estimators that report only to you? If there is a difference, one party or the other has to agree to one number. If you have to be called in to be the sole arbiter, then so be it.

If the numbers that become the official estimate are averages, please do me a favor. Don’t footnote that it was averaged or that the median was used. I don’t want to know. The official number must be the official number. Yes, it must take into consideration that there is a vacancy rate assumed. Until satellite imagery tools are available to compute an exact vacancy rate, then make one up. But don’t footnote what it is. If it’s from your anointed pop estimating laboratory, then keep it secret. I don’t want to know. It won’t matter, because there can be only one number.

One last favor, Santa, would you please check over my compilation of all Texas cities since 1990 that can be found at this safe and secure Adobe site? I worked very hard to combine all of these files.

I have some other questions, but I don’t want to distract you until you have time:

  • Why was Uncertain, TX uncertain about the name they wanted to give themselves? That one is really bugging me.
  • Also, once a city has a name, is there any way you could make it illegal for another city to put North, East, South or West in front of it and them claim it as their own? That’s just not right and makes it so confusing. Make everybody be original.
  • I believe in the punishment fitting the crime, Santa, so would you permit a public flogging of the person who allowed a city to have the same name as another city in another part of the state? That’s just wrong! Putting the county name in parenthesis is not a fix. I want my pound of flesh on that goof.
  • Does the Town of DISH regret they changed their name for free TV service? Is that like a tattoo that you just have to live with for the rest of your life? Did they think that one through and realize it had to be all caps? Do they yell DISH when someone asked them where they are from?
  • Why did Tool, TX let that happen? Was that a positive term at some time in the past or was there a Mr. Tool who decided to gather all of the little Tools and start a town? I’ll bet it never gets misspelled like Balmorhea.
  • Could Cut and Shoot not decide, so they used used both suggestions? I’ll have to look that one up in the Texas Almanac. Perhaps there was a tentative name until they had their first council meeting that didn’t go so well.

It looks like things are going fairly well in Texas, Santa. There were 26,956,958 of us as of July 2014. Adding about 400,000 to 450,000 a year is pretty impressive! I estimated the numbers for 2015 and 2016 using the most recent five-year average. I could get 2015 from another source, but then I would have to worry about reconciling numbers, and I’m flat worn out from putting together what I have now sent you.

Oh, I forgot to mention something else, Santa. I know you are expecting us to provide services to an additional near-half-mil people every year at no additional cost. Sorry Santa, that ain’t gonna happen. However, most are coming with jobs and equity from their California homes, so we will be okay. Just in case you belong to that Tea Party, Santa, I couldn’t resist.

I am about to release this compilation of population numbers to my blog and CityBase readers, Santa. I’ll let you know when I get a landslide of mail telling me the numbers I am showing for them are wrong. Some will use colorful Texas adjectives about how wrong they are.  That’s why I put the source on the bottom of my report. I hope they don’t go probing around the Web to learn there are only about a dozen “official” state and federal agency population numbers available. Most are not sufficiently generous to include much history. The more history, the greater the potential for arguments. We don’t talk to each other here in Texas, Santa. It’s not in our DNA. We’re flexible. We are also optimistic. Our population would be 100 million by now if it weren’t for those dang Census folks.

There are also several agencies that provide future estimates, way past 2050. The problem with some of those official sources, even those used to forecast water demand, is that they apparently don’t have logic checks built into them. Some state agencies estimate cities to have a certain population by 2050. The only problem is that a few of those cities were at those population levels 10 years ago. Others are projected to be way larger than they are now even though they are nearing build-out and are landlocked. Guess we will see some 100 story housing units in Texas someday.

Anything you can do to help is greatly appreciated, Santa.

Your Faithful Analyst,

Lewis

Understanding Data & That Misleading Word, Transparency

I will be talking a lot about Transparency in my blogs, a word that is overused and even misused and abused in government. Yes, there are efforts made by governments and businesses to be transparent. Even the Texas State Comptroller awards programs are designed to promote transparency. Many of those efforts produce translucency more than transparency. I will try to explain and give examples in this blog and in many more to come. However, I must tell you something. I was handed a gift just a few days ago. While the current and past state comptrollers have promoted transparency in local government for many years, a new program has been launched called “Transparency Stars: Recognizing Local Transparency Achievements.

The Texas Comptroller of Public Accounts is proud to announce the upcoming Transparency Stars program, recognizing local governments for going above and beyond in their transparency efforts. Our office will recognize government entities that accomplish the following:

• open their books not only in their traditional finances, but also in the areas of contracts and procurement, economic development, public pensions and debt obligations.

• provide clear and meaningful financial information not only by posting financial documents, but also through summaries, visualizations, downloadable data and other relevant information.

The emphasis on the last few words is mine. I would have to look, but I am pretty sure my writings and presentations on aspects of this subject started 20-25 years ago. Local governments are good at generating data. Operating data. But only in recent years have there been tools and efforts to turn operating data into management data. Some will recall that in addition to 1) summaries and 2) visualizations, I have emphasized 3) exceptions, 4) comparisons, 5) rankings, 6) drilldowns, 7) trends and 8) written explanations.
And even with data presentation improvements, the real test is to determine if the critical message is delivered and understood such as when the Mayor of Dallas pierces through the data and staff babble to declare, and I paraphrase, “the condition of our roadway system STINKS!”

An Example of Transparency Efforts: The Check Register

Many cities now publish an online listing of all of their checks. On July 19, 2015 I went online at the City of McKinney’s Web site and found they had a listing of checks back to 2011. Each year was in a separate file, with 2011 in a PDF format and the other years in Excel. Then I found that over $8 million were written to the bank card company handling the purchasing card program for the City. Of more concern than that to me were a number of vendor payments that were redacted. I expressed my concerns in an email letter to the Interim City Manager and Finance Director attached on that date.

To their credit, they now have an Interactive Financial Reporting Tool that came online in August 2015. As of a couple of weeks ago, they had the old version I was using and have now taken it down. Please note the new check registers and even the payroll register found at https://www.mckinneytexas.org/index.aspx?NID=213. The capability to see more information is truly impressive. They have broken down the PCard spending! They have also UN-redacted many (but not all) of the vendor purchases I had questioned. My compliments to the City of McKinney staff efforts to improve Transparency.

But Does This Effort Accomplish Transparency & Understandability?
The City is providing a check register that almost quadrupled the disclosure of details with over 215,000 pieces of data. I have worn out this quip, but I will continue to use it: as much as I love numbers, I cannot necessarily spot an anomaly by scanning pages of data by eye, even though the City’s sort feature makes it easier to do some ranking. One of the Comptroller’s criteria (downloadable) is of great benefit on the McKinney site. However, it is lacking in looking for the most critical areas of spending that will surface only when summarizing data, then sorting.

For operating data to become management data, somebody has to transform listings into summaries. Even then there must be an appreciation for the Pareto Principle (the 80/20 rule), which simply means I first want to examine the fewest number of (people, problems, items, etc.) that make up the largest impact (dollars, overtime, moral problems, etc). You would still want to see information portrayed for comparison purposes, such as over a number of years, to spot trends.

Excel Pivot Tables to the Rescue

To explain what I am describing, I have a link  to an Excel spreadsheet that takes the good McKinney work and addresses the Comptroller’s new program to make it better. The first tab is the DOWNLOAD of the 215,193 expenditure records from 2010 through January 2016. The second tab, PIVOT BY PAYEE, is where you can see a drilldown that includes 1) the description the City provides and 2) the Fund it was charged to. All elements are sorted from the largest to the small dollars.

Please appreciate this point, whether you are a financial analyst or a city councilmember: The pivot tables have organized (summarized) 215,193 spending elements totaling $998,454,719 into a meaningful presentation that allows you, the reader, to scan the entire $1 billion picture quickly and then to drill down into details at your desired level of information. Folks, that’s powerful. That’s a giant step toward Transparency.

What Do We Do Now?

That’s simple. Read with curiosity. Ask questions. If you are a McKinney resident, this is your money. If you are a councilmember or community leader, learn about where the money goes. There’s a huge amount of discussion in closed meetings that you can’t be privy to, but when the money goes out the door – it’s your business. I can only think of one acceptable condition when the amount and purpose of money going out the door should not be disclosed – the garnishment of wages and payments related to child support. There may be more excuses for redactions but not in my book.

I do have several questions for my city council and staff after preparing this analysis and blog. Actually, I have an Open Records Request for some of the items and should be hearing back soon. Here is my challenge to you if you are a city official: why would you wait for somebody like me to surprise you with a question or perhaps even a finding that you should have already asked and known? The reason I say this is because the dreadful fact is that city officials don’t read their own information. Raise your hand if you have actually read your CAFR in depth. Heck, most cities have been producing a check register for years. As a council, are you looking at that information? The City of McKinney is averaging $104,000 on audit fees. Are you getting more than a drive-by explanation of what’s in it? More coming in a few weeks.

The reality is that the once unavailability of tools for digesting millions of records, slicing and dicing are now available to just about everyone. If you have Excel, you can download years of check registers and create pivot tables in a matter of minutes – no exaggeration.
The Excel spreadsheet is quite large, too big to attach. Therefore, you will need to download from www.citybase.net/downloads/mckinneycheckregisters.xlsm to see the details as well as the construction of the pivot tables. However, I have attached a PDF of the spreadsheet at the vendor/payee level. Vilfredo_Pareto

Oh, and regarding Professor Pareto , you will soon learn the importance of his rule when you continue to be faced with terabytes of data, a meeting agenda that just doesn’t seem to end, or which house repair you are going to tackle first? In this age of information overload, it is the only path to control and sanity. All you have to look at in the spreadsheet is the first 448 items (11.3%) of the vendors/payees that account for 96.4% of the near $1 billion of spending. LFM

Surely You Aren’t for Growing Government, Are You?

If you are receiving this blog twice, it is because you are on one of my lists + you signed up for my blog. I won’t be sending my blogs to you much longer unless you email me to say you want to be on it. I’m also sending from a different address. I know that many of my CityBase subscribers route my news articles into a separate folder and then don’t have time to read them until days or weeks later. If you did not get my original invitation, it is attached to this email.

Introduction

It took me three times to hear it from different people before I fully realized The question, “Let me ask you this, Lewis, are you FOR growing government?” was a baited question. By the third time, I realized it was rehearsed and work shopped, like “Lewis, if you were indicted for being a Christian, would there be enough evidence to convict you?”

The second one caused me to think when I heard it several decades ago. The first one worries me. Both can be intimidating but for different reasons. Actually, my favorite is the question released by the encyclopedia salesman visiting poor rural folk that basically conveyed, “you don’t want your children growing up as dumb as you are, do you?”

Let me get one point on the table. I’m not a Democrat. I’m not a Republican. And I’m not Tea Party. They are all liars, and none of them care about me or my future or my family’s future. They are all self-serving and exist to make themselves look good and their opponents look bad. So there.

This blog is mostly about the question in the subject line.

I’m for the old fashion truth. Facts. Looking for the heart behind the words. Wanting to adhere to the Athenian Oath about leaving this place better than I found it. I’m pretty simple. I don’t like labels that color me inside or outside somebody’s circle. I struggle to be a good listener, and I don’t enjoy being around those who don’t listen. I like civil conversation. Take a few minutes to view this TedTalk clip. After 68 years, 44 in local government, I am still a student. A curious student with a desire to match what I am learning and the words I am hearing with that I am seeing with my own eyes – and verify or confirm independently.

Let’s Dig In

Let’s suppose someone says, “Did you know that the City of McKinney, Texas is an empire building, tax and spend city that has mushroomed, atomic bomb style, from General Fund employees numbering 613 to 841 and with a budget leaping from $80,465,607 to $140,717,846 (that’s one-hundred and forty million, seven hundred and seventeen thousand+ dollars in just ten short years? Hell, Lewis, you live there. Are you for them GROWING THE GOVERNMENT and sucking up those tax dollars like a vacuum cleaner plugged into a 220v outlet? Are you one of those unpatriotic liberals, huh, huh?”

After I peeled all of the labels off of me, I would have this reply. Your numbers are correct yet incomplete. Your conclusion is bad and terribly misleading. I will prove that to you if you are willing to listen. But first – if you will listen and let me speak without interrupting or anticipating your next statement. Then I will allow you to speak without me talking. Is that fair?

First, how do you think all of the services McKinney provides came about? Did the bureaucrats just sit around trying to think of ways to make their staffs larger? Did the council signal to the staff that big is better, so let’s get really great and see if we can grow bigger than Plano?

Have you ever watched their public meetings – they are videoed and archived? What you will witness is a parade of citizens that start out their three minutes with “we need your help,” “please fix this or that” or some statement that is motivated by an unmet need. However, way before that meeting, the staff has fielded several hundred calls or the council several dozen calls from a variety of constituencies pointing out a need. Some are a few representatives from a youth sports league or the biggest HOA in the state explaining a need or perhaps warning of some dire consequences to the public if a health issue isn’t remedied.

Staffs and councils don’t dream up these problems and need for program expansions. Citizens do.

Before I get into some numbers, I’ll stop and let you respond to what I have said.

The Numbers

What if I told you that the City of McKinney was spending less today than 10 years ago? Yes, I said I agreed with your statement of fact that spending went from $80.4 to $140.7 million in ten years. But you left out two extremely important sets of numbers when you tried to make a statement that sounded conclusive and all-revealing with those absolute numbers.

You forgot to mention that the population grew from 104,853 to 155,142 during that exact same time period. Would you have expected McKinney to serve 50,289 more people without there being a cost increase?

The reality is that the City staff in the GF has actually decreased from 5.85 staff per 1,000 population to 5.42 in 10 years (line 14). Do you think your statement might have been accurate but misleading now?

In fact, the cost per capita based on the population growth went from $767.41 to $907.03 over the period in question. That is certainly an increase, but there would still be a missing piece to the more accurate story.

Do you think the costs of labor, material, fuel and other supplies are the same in 2015 as they were in 2006? In reality, the CPI is 18% higher than 10 years ago. Arithmetically, that is only 1.8% per year, which is very low. There have many ten-year blocks of time in the past when the CPI jump may have been 25-35% or more.

Nevertheless, if you care anything about meaningful and accurate comparisons, it is critical that the per capita numbers be adjusted for inflation. There are two ways to adjust the numbers, both with exactly the same accuracy, but with different perspectives. From college and even high school classes you will recall that indexed data can be placed on either a 2006 basis or a 2015 basis.

If you placed the per capita data on a 2015 basis, the $907.03 current value would raise the 2006 equivalent of $767.41 to $905.53. Yes, that is correct, on a 2015 basis, the CPI-adjusted cost per capital has risen from $905.53 to $907.03. A buck-fifty!

If the growth in spending for the last 10 years was restated in 2006 dollars, the change would be minuscule. Does that not amaze you? Do you see how outlandish and misleading you can make the data sound. Yes, it takes a little knowledge of proper indexing which any high school student can do. And a willingness to be fair and accurate before you make assertions.

You might ask if this method of data presentation is so much more superior and accurate then why doesn’t McKinney show the data in this proper context? My answer is that I have no clue. I have been teaching and preaching this fundamentally better presentation all across the state for years. The City of Pearland presents their data this way. Heck, the much smaller Fate, Texas does the same. To expand on this answer would require me to delve into my issues with the overused word, Transparency, which I will save for a future blog.

Other Considerations

What if the CPI-adjusted spending per capita had grown to $1,000? Quite frankly, that was the range I was expecting. There would be an answer to that. First, the real CPI is much greater than the official numbers I have used. Just look at your own personal CPI. Is it only 1.8% per year. Plus there are increased costs of trying to be more effective in municipal service delivery. For instance, more expensive technology to protect a police officer or to help them catch criminals is generally an ongoing ramp up in cost. In every area of local government, there is a desire to be more effective. To respond faster, to repair infrastructure more timely to hold off more expensive replacement and much more.

There are also new or expanded programs. Everybody knows that the most significant way to keep costs down is to never start a program. Yet that is when we cycle back to the source of the demand to expand or even create new programs? The citizens. Park lands or medians looking shabby? Mow once every 5 days instead of every 10 in certain parts of the city. If you plant color beds in the medians, you have to keep up the maintenance. Open a branch library is not just another building but rather more of everything. And new facilities whether libraries, recreation centers or fire stations generally means huge incremental increases in operating costs.

So, how did McKinney add so much and keep the comparative numbers almost flat? That requires more digging, but a mandate almost every local government department lives under is to continually become more efficient. That doesn’t always mean doing more with less but rather doing more with the same. Or doing much more without an increase of resources at the same magnitude.

Conclusion

Apparently, the way to get elected in conservative Collin County and especially McKinney is (before you know the facts), just proclaim that growing government is just as bad as treason and that you are going to just say no with your fingers in your ears no matter reality. Or else. The “else” is that even after you get elected you are going to get texted during a meeting to remind you who brought you to the party, your pledge and the price you are going to pay if you get out of line. Here’s the deal, however, it can work right now in McKinney. Decent quality growth is on steroids, especially residential. Ultra-Conservative Bating is on fire and politically effective. The City of McKinney is doing very well financially. Actually, too well. More saved for blog in the near future.

If you think this blog is going to be an apologist mouthpiece for local government, you are dead wrong. I’ve got plenty I want to share. Stay tuned. LFM

MckinneyPerCap

BTW, if you read to this point and appreciate good analysis work and would like to have a copy of this Excel template, just let me know. I would be happy to email it to you. LFM