I have been writing about and giving heads up about infrastructure needs since at least 1988. Nothing was mentioned much for years. In fact, when I went to the GFOAT Board at the time to request the topic be put on a conference program, nobody wanted to talk about it. Under the umbrella concern from finance folks that nobody was going to steal a street, it died. I was politely thanked and shown the door.
Since GASB was created, that particular Board eventually made a push to recognize Infrastructure cost. The general process for things like this in the governmental accounting world is to 1) don’t talk about it; 2) talk about it and measure it for informational purposes; 3) measure it but put it only in a footnote and 4); place it on the income statement and balance sheet. I wrote years ago that some cities are bankrupt and don’t know it. When assets turn into liabilities, it can wreck financial statements to make that most basic acknowledgment
The finance folks fought GASB at first, but we now about a dozen years of Infrastructure and especially the Depreciation numbers appearing in the CAFRs for the General Assets. In the footnotes. I am pretty certain that nobody has highlighted this information to their City Councils. That’s a shame. I often wonder how many City Managers even look at these numbers to put dollars to the gigantic investments in assets under their watch? When I started writing about Infrastructure that many cities may be bankrupt and not know it, I wasn’t kidding. Move that General Assets Depreciation number to your income statement and tell me how you look?
The picture gets worse when you realize the Assets of this nature are stated as historical costs only. And, get this, a huge portion of those assets weren’t built with city money anyway. They were built by developers and builders and then given to the city. To make matters worse, many of these development assets were built by cutting and digging through open corn fields without thousands of cars whizzing by. So, bottom line, the city gets to maintain, repair, rehab and replace with city money at today or future costs plus a premium for the time and danger to work in established traffic lanes at off-peak hours and weekends.
And worse, realize that all these assets are on a slow march to deterioration. Wait long enough, and the pace picks up. In 1990, while working on Impact Fees in Plano, the point was made about the very high percentage of their infrasture that had been built during the previous 15 years. Almost as quickly as the words were said aloud, the staff and consulting team realized that at some point in the future, there would be a bubble when those millions of miles of infrastructure would wear out in about the same short period. Ouch! BTW, that was 29 years ago. That bubble is here and has been here for a long time!
The Cost of Deferral
We are all familiar with the number one method of balance a budget – heck, just defer. Kick the can down the road, as the phrase goes. And that may just be one of the reasons some cities are so reluctant to do multi-year financial planning. Kick the imbalance to next year and … well, now that year and future years’ deficits just got deeper. If I were new to a council and discovered decades of decay had been shoved ahead for me to face, I would not be silent. I’d take care of the problem and show the tax rate spike that is a direct correlation to the malfeasance of neglect from councils in the past shoved ahead to my term. Why would I apologize, and why would I act surprised?
A Picture, Please!
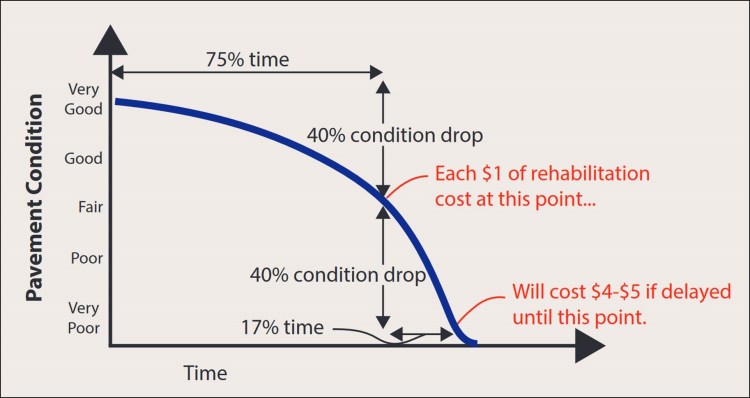
The City of Carrollton provided an Infrastructure Report Card in 2011 and then updated the report in 2014 and 2018. It’s a must-read unless you don’t like to be bothered by future threats and sober reality. See https://www.cityofcarrollton.com/home/showdocument?id=13439.
Inside this report is a most fascinating diagram. I doubt that you need help understanding it. It is profound. You need to keep it in your hip pocket and pull it out as regularly as you show pictures of your kids or grandkids.
Hit Me With Another Cheery Note, Lewis!
Thanks for giving me the permission to say everything again in another way.
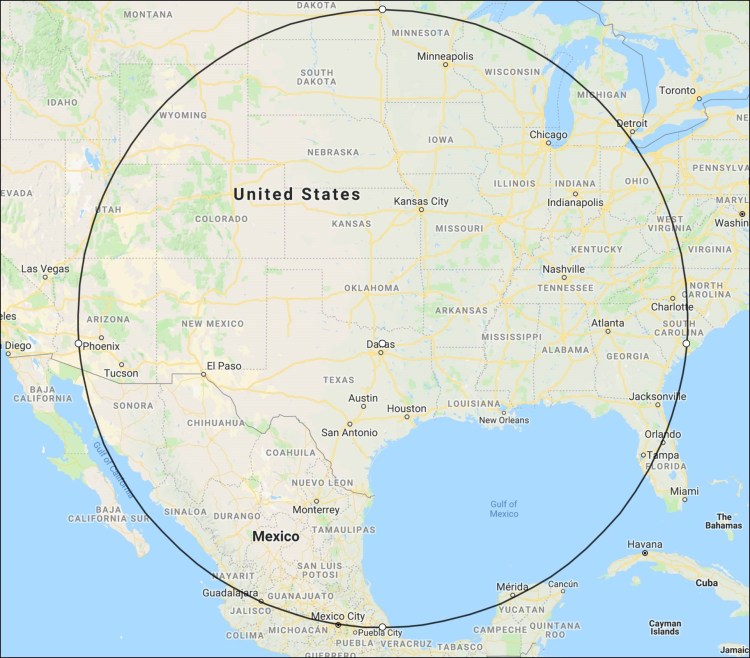
I have found another helpful tool to easily obtain a statistic and a visual I’ve used several times doing a lot of manual work. This one is very useful and here is how it works. Go to your CAFR and pull out the number of miles of roadway in the Statistical Section. In my City of McKinney, it shows there are 802 miles of roads the City has to maintain. It also shows 960 miles of water mains and 713 miles of sanitary sewers. The last two are invisible – until they become visible, and then you’ve got a big problem.
Gee, that sounds like a lot, but look at my better way to say it offered here. If I were to draw a circle with a radius of 960, the picture below tells the fascinating story in a different and disturbing way. What would you expect from the Master Disturber?
Below is a circle with a 960-mile radius. That’s the picture of the assets for which you have been deputized to be the steward. That’s the “service area” stretched out in linearly. That’s the workload plan in some form or fashion.
I’ve driven these distances before (but not in every direction). You can have this sterile little statistic of 960 miles in a report. You might even say it verbally without it fully registering, especially if your staffers talk 100 mph without pausing when giving reports. All a yawner, perhaps. Try using a picture.
Hey, I’m just trying to help you tell a story. And as much as I love numbers, a picture is often much better. LFM
https://www.mapdevelopers.com/draw-circle-tool.php