It’s been about 12 years since I started writing about this topic. Originally, I was kind of in a panic. I thought we were on the verge of something ugly happening any minute. Since then the problem has only grown worse – much more so. However, my mind has morphed into Clark Gable’s attitude toward Vivien Leigh. Frankly, my dear, Elvis is dead, and I don’t feel so good myself. Okay, my apologies, I stole part of that thought from Lewis Grizzard of the Atlanta Constitution (may he rest in peace), but I just love it!
When I first started following the US Debt and Deficit levels seriously, I was worried about me. Us. Then as time went on, and I knew my generation wouldn’t be able to ever pay it off, I started worrying about my grandchildren. They would have to pay for it. I no longer have that worry. The reason is that their generation and all future generations will never be able to pay off the US debt. And they shouldn’t.
Let me provide an update on my initial worry. The US Debt as of March 21, 2019 was $22,028,692,383,333.10 (https://www.treasurydirect.gov/NP/debt/current). It has ramped up quickly. The table below provides a glimpse of the speed and magnitude, the two critical metrics that typically predict when a Ponzi scheme is about to explode.
It took years for the US Debt to go from $5 to $6 trillion. Then we pass through the $7 to $9 trillion thresholds averaging 645 days each. Then it got easy. We zoomed from $9 to $16 trillion in about 239 days each, the lowest being 167 days. From there we got from $16 to $20 trillion in 459 days each.
Sounds like we were “improving,” right? Not so fast, Citizen Oblivious. We leapt to $21 trillion in just 188 days, like a breeze blowing your hair in a convertible. And then for the most recent ceiling, we cross over $22 trillion in 333 days. Not even a year.

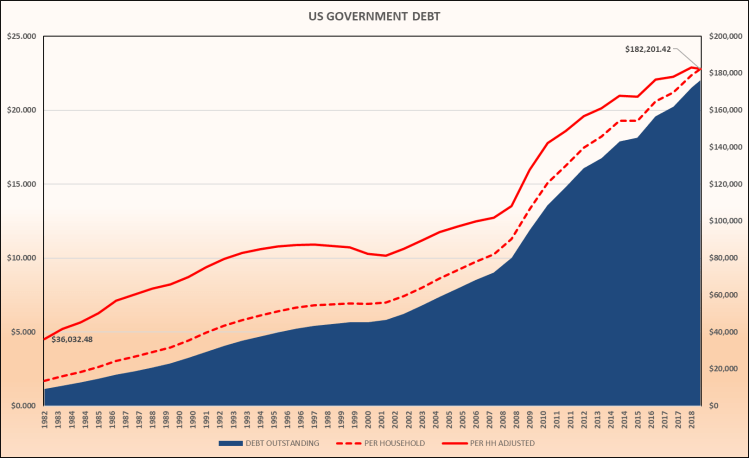
How much is $22 trillion? There are so many ways to measure. Give me a few tries here. If that number were $1,000 bills, the stack would reach 1,495.7 miles into space. Still hard to see? How about we divide by the number of households as shown in the chart below. $22 trillion equals about $182,201.42 per US household. Staggering, huh? Would you like to write that check today or wait until payday?
Oh, I adjusted the historical dollars per household to today’s dollars just to show it’s well over a 5x jump since a 37-year-old was born. But I’ve got some better perspectives to show you, although your indigestion might get worse.
How is the US Government paying interest on all that debt? Here’s where it gets real interesting. The annual interest costs alone (never mind the principal) has grown from $214.15 billion to $523.01 billion since just 1988. That’s bad, but you haven’t seen the worst part. The average interest rate in 1988 was 8.23%. It is now just over 2.40%.
Can you guess now why the Federal Government has been slowly moving debt from longer-term to shorter-term? Can you now see why the Federal Reserve has been artificially lowering short-term debt rates toward zero? Does it make sense now the panic from those in the know if inflation rises and interest rates do the same thing in lockstep? Did you really think all along that CPI numbers were true numbers when the methodology has changed many times over the last couple of decades, always resulting in a lower number? (https://www.investopedia.com/articles/07/consumerpriceindex.asp)

Here’s the best perspective yet. the US Debt is mostly the result of overspending. The chart below resembles a portion of Texas, but it is really the cumulative effect of the actual annual deficits when revenues exceed expenditures. Simple math. Devastating results. Since 1980, when deficits really starting climbing, the US Government has spent $13.808 trillion more than it has taken in. It doesn’t take long to dig a deep hole, does it?
Related, February 2019, the most recent monthly deficit, was $233,978,000. That is by far the largest single month EVER.
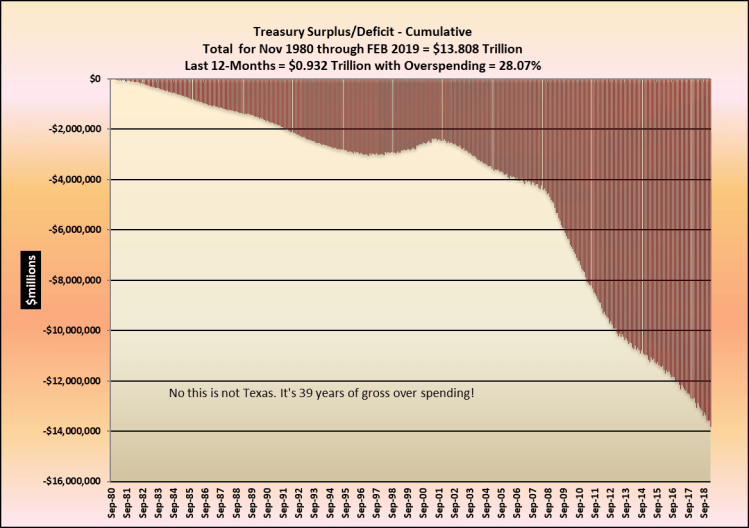
Okay, here comes the Grand Finale on this topic. This is why the deficit is never going to go away, and why the debt levels will only grow toward Mars. Right now, if the US Government were forced to balance the budget, it would require a 28.07% revenue increase or expenditure cut to stop the bleeding.
Mind you, we would still have $22 million sitting there staring at us like the end of the malfunction scene in RoboCop when the errant machine was finished and sitting there smoking and the guys are yelling “don’t touch him,” speaking of the victim (Citizen Oblivious?). (https://www.youtube.com/watch?v=ZFvqDaFpXeM)

Conclusion
Holy Cow! How did we get here? Every president and every member of the Legislature has led us to this moment. And they are just responding to the Citizen Oblivious. Give it all to me, give it to me right now, and don’t make me pay for it. Hey, I’m in the second class of the Boomer’s. I’m from the generation of What Me Worry? (https://en.wikipedia.org/wiki/Alfred_E._Neuman)
I was worried 12 years ago. Dangest thing I’d every seen. I doubt I’ll be here in 12 more years. Party on, Grandkids. We caused it. We knew it. We elected not to do a thing about it and voted in people to do out will, except to make it worse. LFM
