We generally don’t get hit as hard nor do we get hit in lockstep with the National Economy. But we are not immune to recessionary forces. And that is good.
You may think the flashing signs of a recession just happened overnight with interest rate inversions moving to the front burner this weekend. That is not the case. The yellow flag believed to be reliable is when the interest rates for the short-term government securities rise higher than the long-term. It’s a worry indicator. Why else would someone accept a lower interest for holding a 10-year government bond then for a 90-day T-Bill? It’s an inversion. We don’t like it when things are askew.
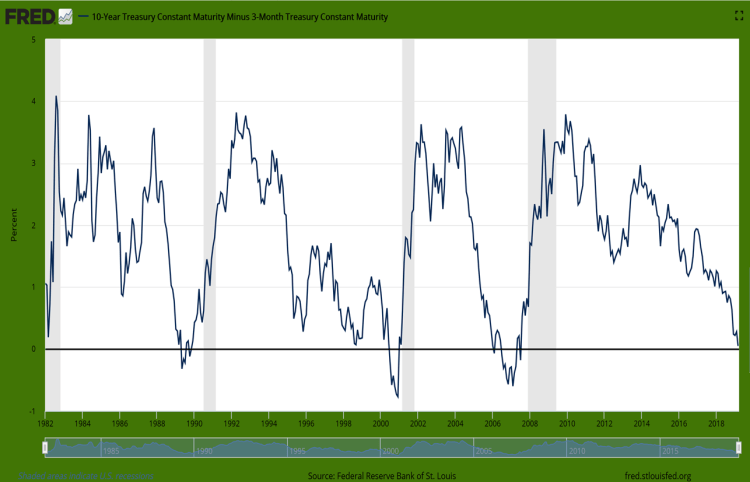
Our accepted correlation that a recession follows an interest rate inversion isn’t something dreamed up by economists. The chart below from the best source of government (and business) information is from the FRED, the Federal Reserve Economic Data site provided by the St Louis Fed. See http://www.fred.stlouisfed.org. They allow all of their graphics to have an overlay showing past recessionary periods.
Here you can see recession frequencie and durations. You can also see how the widest distance between these two investment instruments begins almost immediately when a recession is over and then goes into a slow decline until the point of inversion and another recession begins. So, the last recession ended in June 2009. As these rate differences zig and zag, they eventually move close together. But we’ve only had almost exactly 10 years to play Carnac the Magificant. (See https://en.wikipedia.org/wiki/Carnac_the_Magnificent). Hardly a magic trick or an academic secret.
Note, please, that we are way overdue for a recession. You might recall that for years the Federal Reserve has been manipulating the system with their toolbox of policies to stave off an inflation and keep employment high as long as possible. Recall, too, that economic cycles are part of a capitalistic system. We don’t like ugly, and job layoffs are as ugly as it gets, but that is part of wage management and pricing equilibrium. Beware when we allow our decision makers to abandon the Invisible Hand Theory. See https://economictimes.indiatimes.com/definition/invisible-hand. The penalty might prove to be severe in our future. But then, what do I know? I thought we were going to have the cataclysmic implosion in late 2007.
This inversion phenom is why you started hearing about the signal being flashed over the weekend and why you may likely hear it a lot more in coming weeks and months. The big worry is just how serious the stock market (another early indicator in most cases) might buy into this cautionary flag.
By the way, you should know that the powers at be declare a new recession well after it has actually started. The same goes for the end of a recession. The official finding comes many months after it is over. It takes some time for two sequential negative GDP quarters to be measured. Interesting, huh?
Not To Worry – We’re The Great State of Texas!
Actually, that is a fact. We have buffers. We also have things in motion that don’t change directions quickly, like a huge cruise ship headed out of the gulf. Well, one in calm waters, anyway.
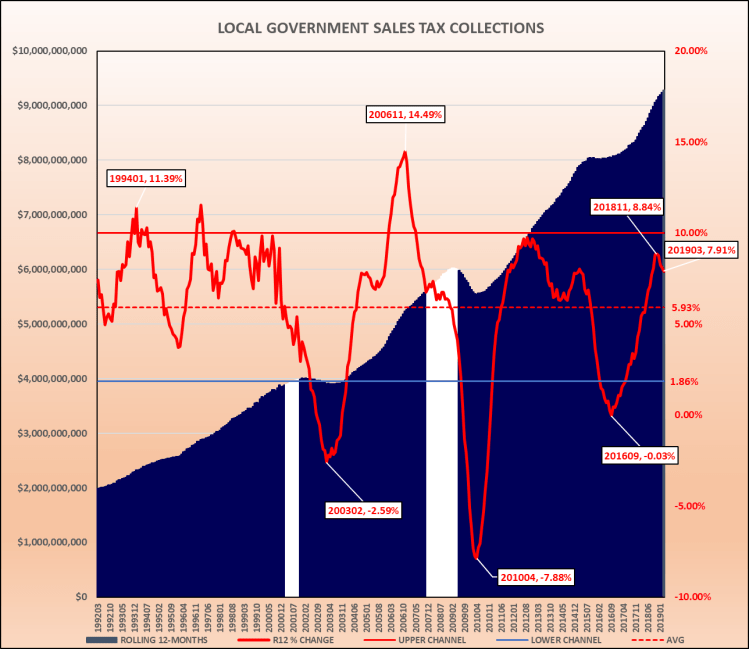
We’re insulated but not immune from turbulent waters and high winds. Fortunately, we have a two-month, not two-quarter, early-warning system. My sales tax chart below shows the rolling 12-month sales tax collections for local governments since the early 1990s. We busted through $9 billion annual collections (in the dark blue) with ease just a few months ago. Yet my favorite indicator is the percent change in the annual growth (in the red). I also marked the last two recessions on my chart this time.
The takeaways include that our sales tax collections locally have been slowing in the growth rate. That means we are increasing in dollars while decreasing in the rate of growth.
Can it go back up without going down any deeper? Yes, and that has happened many times. Is it natural to start declining? Yes, history shows that it is very difficult to grow at large rates and sustain that growth forever. In fact, you can see that almost every time we approached the upper boundary of the 1-STDev channel of about 10%, we pull back toward the statistical mean. That works in both directions.
Keep in mind that the overall average for the last three decades is about 5.93%. That’s not an accidental number. The average is the result of 1) population growth, 2) inflation, 3) the wealth factor as well as changes to the 4) sales tax rate and 5) base over this long period of time. If we averaged about 6% without the huge swings, we could describe that scenario as near to perfection as possible.
Also, please note how you could use the chart below to say with confidence that the Texas Local Government Sales Tax Collections may be able to announce a national recession ahead of time with the red line AND YET we can safely say that we tend to lag the recessions by quite a few months. That may be a stretch, but this can be a compelling argument in light of historical data.
Conclusion
What are we to do with this information? First and foremost, just watch. If the rate inversion goes deeper and the sales tax growth rate decline continues and even accelerates, then we can confirm we are sliding into a recession.
It’s way overdue. Job-cut announcements started months ago and are increasing in frequency. In Texas, there is a huge business commitment in place that doesn’t stop overnight due to the inertia.
Take shelter mid-year? Not really unless we get slammed in a hurry? But FY 2020 might be facing a challenge.
Look ahead, but I offer you this challenge. Recessions have typically not lasted long (18-24 months). Please don’t make the mistake of start cutting back on things unnecessarily.
Why do you have those fund balance reserves? I would say it is to continue basic operations without cutting jobs that you will be hiring back not too long after the cuts. Provide those services, keep productive staff and don’t gut the programs.
And keep your hands off the dang libraries, ball fields and animal control!
Instill deep quarterly reviews of all revenues and expenditures with your staff. Announce to the rating agencies that programs are important or else they wouldn’t be there. A reduction in fund balances will be followed by a restoration to policy levels.
A Rainy Day Fund is meant to be used during these kinds of pullbacks.
In closing, a little jab. If you are waiting for a good recession to force yourself into making cuts you should be making every day as a manager, that’s cheap management. Just saying. LFM
