McKinney Police & Fire Unions Have No Business Being Involved in Political Influence Peddling

Introduction.

There is nobody in Texas more supportive of police and fire than I am. For over 44 years I have been involved in lifting them up, praising them across the state and letting them know how important they are to us. My wife and I never miss an opportunity to thank them for protecting us. Our biggest joy is when we offer to buy lunch for a table full of first responders at a restaurant. Our prayers frequently include a specific mention for public safety workers to be protected from harm.

But I have also been the budget director or financial planner to many cities and a couple of counties in Texas. I appreciate all local government workers. My wish is for us to be able to do everything we can to support everyone. While I think of those risking their lives, the municipal family is much broader to me. There is nobody I respect more than the water department workers who are called out at 2 am in the freezing rain to dig a hole to climb down in so they can fix a busted water line in order to service to be restored before I wake up.

Violation of Council-Manager Form of Government.

For the City Council (or candidate) to reach out for direct support and sponsorship by the Police and Fire Unions (or any city government employee group) is just flat wrong. In essence, it is saying my boss is the Chief, and his/her boss is the City Manager and his/her boss is the City Council and their bosses are the Citizens. So, to hell with the legal structure the Citizens adopted in the Charter. Let’s gang up and try to influence the last two echelons of the City’s intentionally selected form of proper governance.

It’s the most basic form political manipulation in McKinney. The common phrase is “count to four.” That means if you can get four votes, you can do or get just about anything you want in McKinney. That is why developers and real estate people are such prominent financial contributors in local races. But the most dastardly maneuvers by that particular group pale in comparison to an employee group trying to pick their boss’s boss two or three levels up.

McKinney Citizens Are Being Duped.

Here is where the Fire & Police Unions laugh all the way to the voting booth. Citizens are under the impression that there is a massive amount of support for a candidate. However, do this math:

  • How many people are in these two departments?
  • How many of the employees of these two departments belong to the Union?
  • How many of those employees actually live in McKinney and are eligible to vote?
  • How many of those voting are doing their own thinking or just following the Union leadership?

Wouldn’t it be funny if having the Police & Fire Union blatant support isn’t really generating that much political favor if the rank and file, not to mention the other city employees, quietly vote the opposite? I don’t know the exact numbers, but I’m guessing there are a small handful of actual employees making it appear has if the entire forces are championing a candidate. Politically brilliant, I suppose, but a charade.

Conclusion.

Citizens, be suspicious of this aspect of McKinney’s Underground Government. It’s real, and the only way it is ever going to change is by new blood. 1-2-3-4.

I will continue to be a cheerleader for all employees in local government. But I will always see a red flag when an employee Union is deliberately trying to manipulate an election! LFM.

Is McKinney Sandbagging Revenue Estimates?

McKinney is asking for citizen input for the upcoming budget at tonight’s meeting. Since most citizen comments are limited to only three minutes, I am opting to blog my observations on sales tax revenue assumptions.

I monitor sales tax revenues for every city, county, transit authority and special district in Texas every month. That would be over 1,600 local governments. Due to the beating levied on the oil patch regions in Texas, the total collections have been relative flat for about 18 months. But the total $8 billion annual local government base has been stable and is now growing again.

However, while many regions have suffered, that is not the case for others such as in North Texas. The collections have been robust in the DFW area. Let’s look at McKinney in particular. On a Rolling 12-month (R12) basis, there has been constant growth at an impressive rate since the Great Recession. As of April 2017, the City has collected $48,852,787 in the last 12 months, the highest ever. Just about every month is another record breaker.

The annualized growth rate is 11.34%! The R12% is the most telling and sensitive indicator of growth. It will announce slowing, peaking, bottoming and recovering points way before you can grasp the changes in dollars. The R12% is an incredibly robust metric for McKinney. Double-digit growth is difficult to sustain. But half that amount isn’t.

April 2017’s check was $216,062 higher than April 2016 or 6.57% more.

By the way, you can see the anomalies such as the positive $5 million + Audit Adjustment McKinney received back in 2011. The R12 spiked for exactly 12 months and then returned to its strong growth trend.

But let’s shift our attention to the Sales Tax Per Capita calculation. On a statewide level, Texas local governments are receiving $161.86 per capita on a 1-cent basis. McKinney is collecting $139.32 on that same basis. That can be translated into $3,951,225 below average or twice that amount since McKinney collects the full 2-cents allowed for local governments. But we knew that even before the City spent money to have a “leakage” study done in recent years.

McKinneySalesTaxChart

But let’s put $139.32 per capita into perspective. I prepared the chart below a few months ago and have not updated it. However, the value remains. It is instructive to look at McKinney’s Sales Tax Per Capita when you can see several years of history and adjust the calculations for inflation (CPI).

You can see the fluctuations that come from a mix of population growth and economic peaks and valleys.  You can see clearly where McKinney has been in recent years. This metric was $133.26 at the end of the fiscal year 2016. I had projected that it would rise to at least $137.81 at the end of the current fiscal year and then up to $139.61 at the end of FY 2018, the budget year for which input is being requested. I was intentionally slightly conservative. I used an inflation rate of 1.75% when it is likely to be above 2.00%.

This estimate translates into the following, again, on a 1-cent basis:

  • FY 2016 $23,594,961 Actual without any audit adjustments.
  • FY 2017 $24,917,139 or 5.60% higher than FY 2016.
  • FY 2018 $26,367,347 or 5.81% higher than FY 2017.

So, there’s my input.

PerCapita

In looking at the agenda packet for tonight, I find a presentation that indicates a sales tax growth rate of 2.06%! It does not say whether the growth rate is going to be applied to the 2017 Budget, the 2017 Revised Budget or any other base. That’s important. It appears to be scientific in that it is the composite of the Fed Median GDP Projection; the 10-Year Dallas Fed PCE; the 10-Year Rolling Average; and the Low 5-Year Average.

Hold on a second. I’m not sure any those are logical linkages. Here is what I do know. I have prepared some very sophisticated sales tax modeling algorithms in my career. And no matter the degree of complexity or academic statistical excellence I worked into the model, my last step had to include dividing the numerator by the denominator (residential population and employment) to come up with a Sales Tax Per Capita value.

Questions Abound

On the surface, the concept of making conservative estimates sounds noble and smart. But here is the problem. Actually, there are several problems. If you are too conservative (lowering revenue estimates and raising expenditure assumptions), then what is there to manage?

One can brag about how the spending came in under budget. Big deal. Not to hard to do with enough padding.

One might even brag about how money has been “found” mid-year to come in and save the day for new need, especially a political need. In my career, I have seen how eventually nobody needs to fight for resources during the budget. Just know that the real budget “tightening” will come when the budget is revised mid-year in face of the true income and spending levels. Except “tightening” can turn into new-found money (oh how I hate that phrase).

The net result of being overly conservative, other than the kudos for rescue funding mid-year, is that reserves get boosted. But then that argument gets abused. If you have 60 days of operating reserves, wouldn’t 90 be better? Well, if big is better, then why not build reserves up to 180 days. Where do you stop?

Next, comes the most insincere and most abused argument of them all: “the bond rating agencies want big reserves or else they will drop the bond rating.”

Rage sets in on me. I’ve watched the McKinney finance staff shut down a legitimate question asked by a councilmember by simply invoking the “Bond Rating Agency Threat.” Grounds for dismissal in my book. Especially the Deputy City Manager who directs the financial staff. He knows the game, and recent abuses have been on his watch.

But here’s the deal. The bond rating agencies place a high degree of emphasis on fiscal management, including controls and planning. They will even hang with you if you are in trouble. They mainly want to know a couple of things: 1) do you know you are in trouble; and 2) do you know how to get out of trouble?

Want to know how the bond rating agencies will react to something? Go ask them! They are approachable. Plus you pay them a big fee to be rated.

Here’s something else I know. McKinney is flush with reserves after years of overly conservative budgeting. I won’t be handing out a badge of honor for big reserves when there are legitimate needs for spending – or to cut the tax rate.

And I know this. Overly conservative sales tax budgeting boosts the need for property tax revenues. It works like this. A penny on the tax rate produces about $1,700,000. A one percent change in the sales tax revenue equals about $260,000. Low ball the sales tax revenue by 4% and you need the property tax rate equivalent of $1,400,000 or a TRE of about 6/10 of a penny. ($260,000 x 4) / $1,700,000.

So, do this at the McKinney meeting tonight: ask for the Budget vs Actual for Sales Tax Revenues for the past five years. Ask what the revised FY 2017 sales tax revenue estimate is expected to be now that nearly half the year has gone by. LFM

BTW, if you want to see the first chart for every entity in Texas, you can download my charts I prepare monthly. It’s a big PDF file.

You can view “StatewideCharts201704.pdf” at: https://files.acrobat.com/a/preview/8bd7f399-4e3a-48e0-a717-50b9b92e7125

Distractions

The reason I went dark from November 11, 2016, until now is that I have been distracted.

Not all distractions are attached to bad reasons. But they are distractions just the same.

Maybe it started with the presidential elections. The person I voted for won the election. I was surprised and ecstatic. I predicted if he won that he would be a train wreck. If so, let ‘er rip! I’m tired of talk, talk, talk. Dumb Republicans had eight years to groom a candidate but let an Independent steal their party. They got what they deserved.

But after I suffered for eight years and never complained publicly, I’ll not spend a second listening to the whiners who want to protest at sufficiently loud levels as if the more noise will rewind history. Rally all you want. I can’t hear you!

I equally despise Republicans and Democrats. And most of all, the Tea Party. But I do have one good thing to say about the TP (and only one), which I will save for a future blog.

For a long time, I have cherished silence. That need is growing. I opted to send my sister-in-law in my place on a family cruise at the last minute in early March. I spent a week in silence, just working. I watched zero on TV, and still have not turned on my office TV. I deactivated my FaceBook account and still have not reactivated. Same thing for LinkedIn. And Twitter. I do get plenty of news alerts that I read since news is one of my primary businesses. Silence is golden to me.

I am distracted by McKinney politics. Well, until I checked out a few months ago. McKinney is run by an underground that key people in the know will not deny. They also won’t do anything about it. In fact, they have winked for so many years that newbies know no difference and aren’t about to mess up the favoritism playpen. That might change with this upcoming election. Hope so. But it’s going to take some major changes on the Council and inside City Hall.

It bothers me that AG Ken Paxton is abusing the legal system to save his hide. I’m sitting in the middle of Collin County, his Mother Ship, and his nature of doing business up here is legendary. He is bad, but his worshippers won’t admit it.

It got distracted by Bruce Springsteen standing up in a foreign country and telling the world he came to them as an embarrassed American. I was okay with his rants and others before the presidential election, but I was ready to puke when he (and others in the entertainment industry) wouldn’t give it up after the election. After listening to him every single day for decades and giving my family instructions to bury me in one of my Springsteen shirts, he is dead to me. He does not exist. But, honestly, I am grieving. You would have to know what his music and performances meant to me to understand.

Perhaps distractions are affecting me differently since I am turning 70 this year. I don’t feel THAT old. My mind says I am much, much younger. Or so it seems. But my preferences are to stay in my cockpit of two computers and ten monitors to work, think, analyze. And maybe even start writing again.

I’ve sworn off going to conferences. The last one I attended included me falling off the back of the stage just before I spoke. The one before that I forgot my conference clothes and came back from Houston before it even started. The one before that I had to return just before the conference started due to my mother’s impending death. I think the message is clear: stay in your cockpit, Lewis!

I have had some health distractions. Nothing serious, yet, but true distractions.

When I said that not all distractions have been bad, I was particularly thinking about a project I am working on with a client under new city management leadership. It is a multi-year contract to provide an entire series of budgeting, long-range planning, utility rate studies and more. I am considering it to be my final exam regarding just about everything I have done in my 44-year career. I am having a blast.

I started part of this approach years ago, but now I have a real application. I am calling it McLain’s All-In, Top-Down, Visual Skinny Budgeting or Skinny Budgeting (I was using the term before Trump picked it up). If I could work “No Stone Left Unturned” into the title, I would do it. More on that subject over the next few months. It is a dream project for an analyst like me.

Related, I have closed my Confidential Sales Tax Reporting & Analysis work to only current clients until 2018 so I can focus on just them as well as my new project. I have a great client base of 15 cities plus DART that includes 13 cities.

In my career, I have done hundreds of workshops, presentations, and analyses for no compensation. Willingly. To serve the entire municipal family is an honor. I am changing that slightly. I won’t be doing any presentations in the future. Too many rude people in the audience checking their phones for messages or talking.

The exception will be a workshop I am going to do in a few months to promote Skinny Budgeting. I won’t be seeking new clients for anything other than fee-based training. I just want to see the approach used in governance and fiscal policy decisions.

On the other hand, I love one-on-one conversation. I am happy to meet with anyone willing to come to McKinney to chat over a cup of coffee. I also will usually respond quickly to an emailed question on just about anything within my knowledge base, which is narrowing. I treasure my pen pals.

My blog will provide a considerable amount of my thoughts and analyses for those who sign up through http://www.citybaseblog.net. I feel called to write, but the time competes with everything else I do.

Otherwise, I plan to take care of my CityBase subscribers, my Confidential Sales Tax Clients and my one Skinny Budgeting client.

I’m not sure about where I might head blogging about McKinney politics. If the governance and culture do not change, McKinney politics will be dead to me. Not worth it. Life is too short. But I am hopeful that some will leave and go crawl in a hole somewhere. And that some staff who are part of the underground will be run off. We’ll see. LFM

Captain Obvious To The Country of Oblivious: The Math Won’t Compute Forever!

I am approaching my ten-year anniversary of writing about a subject that causes me to feel like Captain Obvious speaking to the Country of Oblivious. Some of us are numbers people, some picture people and others word people. I like all three and try to use every tool to communicate. There are five charts below. Let me see if I can summarize them succinctly.

Chart I shows the US outstanding debt from the early 1980s through September 30, 2016. Think Presidents Reagan through Obama. We now owe $19,573,444,713,936.79 in debts. To place $19.6 trillion into a proper perspective,  I have shown this mountain of debt on a per household basis and then adjusted for inflation. The load has risen from $33,017 to $164,695 per household for 4.99x over the relatively short chart period.

This does not include the present value of Social Security and Medicare, which have estimates of over $100 trillion according to the Dallas Federal Reserve. This does not include your personal debt, nor any state, county, city, ISD or special district debt, including the present value of retirement benefits.

Chart II looks like a portion of Texas. It’s the cumulative amount of debt attributable to operating deficits. Here is a recap (in $millions).

               The Total Deficit as of 9/30/1980              $     907,707.
               Deficit Spending Since                                  $11,822,278.
               Debt Sub-total                                                $12,729,985.
               Debt Outstanding at 9/30/2016                 $19,873,445.
               Difference (Off Books???)                            $  7,143,460.

Yes, the debt has soared. By every President and every sitting Congressional Member no matter the party in control since 1980. Chart II also shows the percentage of overspending on the disclosed operating budget. Right now we are at about 17.98% and have averaged about 20% over the chart period. One way this metric could be interpreted is to say that revenues would need to be raised or expenditures cut (or a combination thereof) by 20% to just breakeven on the disclosed budget and probably about another 10-15% to cover the Off-Books spending. That might stop debt from growing but not pay off a penny of the $19 trillion. Raise your hand if you believe either will happen.

I’m pretty sure my 8th grade granddaughter is working story problems more difficult than this one to figure out where things are heading.

 Charts III and IV give us an idea about how we are pushing the limits on what we can expect to be milked from the overall potential revenue base. All you have to know is that every dollar of our annual Gross National Product totals about $19 trillion. And the US government revenue base is $3.3 trillion. Logic would say that if the federal government is taking in 17.20% of the GNP, that’s big no matter how you measure it. Again, layer the state, county, ISDs and other special districts and … you just have to appreciate reasonable limits.

 Chart V is just one of the fabricated and dangerous aspects to the reason we haven’t collapsed since I started predicting so ten years ago. The inflation and interest rates can be manipulated by the Federal Reserve. It has now been so long that many of the newer families and employees don’t realize what has happened. To control rising Social Security costs and to lower the amount the US government pays on interest toward this staggering amount of debt, Chart V shines the light on the gimmick.

Interest rates on US Debt have been lowered from 8.23% in 1988 to 2.21% in 2016. The eye can figure out quite quickly the impact if we were dealing with true interest rates, rates that took real inflation and real risk into consideration. With an expenditure base of about $3.856 trillion, the interest expense of $0.433 trillion is about 11.22%. What would the 2016 disclosed budget operating deficit of about $0.588 trillion have looked like if interest costs were in the 5% range? Close to double. See the motivation our leaders have to manipulate the numbers?

There is another big issue here. Retired people hoping to make it on their 401k and Social Security benefits are getting shafted. The tendency at that age and stage is to be conservative and safe. And for the last several years that kind of thinking will earn retirees very close to zero. I never thought I would  hear serious discussions and see real actions to drive interest rates below zero. But here we are.

To be fair, many Social Security recipients and almost all Medicare beneficiaries are receiving much more out of the system than they ever put into the system – another faulty math problem that has led to the big deficits and debt.

 Conclusion.

The perfect storm is coming as it relates to the sustainability of gimmicks and outright massive spending to keep things afloat. One of the ways the Federal Government has taken advantage of low rates is to move to shorter term instruments. The problem with that is like having a 6-month mortgage instead of 15+ years. You and the lender come face to face frequently, always with the possibility that the lender doesn’t want to reinvest.

The lenders of the $19 trillion are first the government itself. The Social Security funds temporally on hand, for instance, have been used by the Federal Government to pay for operations. Those funds held by foreign countries are not a small part of the lender base. Yes, we are viewed as a safe haven, but that’s mostly because other countries are worse.

 And isn’t that a sound footing to be on? Especially as we want it all, we want it now, and we want somebody else to pay for everything. Good luck, Country of Obvious. That arithmetic is eventually going to catch up with us! LFM

 Chart I.

charti 

Chart II.

 chartii

Chart III.

chartiiiChart IV.

chartiv

Chart V.

chartv

Looking at Accounting Fundamentals for a Company Called CopSync

Introduction.

There is an Addison-based company called CopSync (NASDAQ: COYN) that has had my attention for the last couple of years. I first got interested because of their connection to AG Ken Paxton. While his world was falling to pieces over securities violations related to a company called Servergy, which appears to finally be going to trial, I got interested in CopSync. Paxton owns or at least owned a sufficient number of shares in CopSync for him to be one of the handful of stockholders disclosed in financial filings. My curiosity was whether AG Paxton was the recipient of shares of CopSync for the same reason he was for Servergy, and that was to be compensated for promoting the firm.

I’m still curious about the Paxton connection, but my attention has drifted to other aspects of CopSync. One has to do with service. However, I cannot find anything derogatory in the public domain regarding their product or services. And I’m glad. That would be my concern if so since CopSync serves local governments, which I do consider to be my bailiwick. CopSync serves a number of local governments, almost all very small.

For instance, a recent press release for CopSync states that the City of Helotes has joined their network of customers. The number of customers appears to be quite large, 530 agencies in fact. That would include thousands of police officers in 15 states across the US. I believe I have seen numbers in previous press releases of approximately 670, so I’ve got some questions about the customer base. However, 530 agencies would be an impressive number.

Yellow Flags.

I have seen some caution signs. The public relations firm for CopSync must be very effective in that I receive a Google Alert multiple times each week. One example states CopSync’s network “is the nation’s only system connecting law enforcement officers and agencies nationwide, and provides access to a national database of non-adjudicated law enforcement information and real-time communication capability to connected agencies, even those thousands of miles apart.” That just seems strange to be the ”only” system in the nation, but I could let that pass my filter. I always watch for words like “best,” but I guess that would be redundant if you are the only one out there.

My curiosity expanded when the news alerts for CopSync included highlights like “The Company is conducting pilot programs with the San Antonio PD and with the Sheriff’s Office for Bexar County.” Whoa, Baby! In my 42 years of working with local governments, the one thing I have grown to appreciate is that tricky little thing called scale. It’s the garden hose vs fire hydrant kind of scale. Nevertheless, I wish CopSync well and hope it all works out.

Although advertising hype is absorbed and discounted in most of our daily lives, that’s not the case when it comes to publicly traded companies. So then came another announcement from CopSync that caught my eye and caused me more worry. The headline in caps said “FIRST MAJOR TEXAS METROPOLITIAN AREA POLICE DEPARTMENT JOINS COPSYNC NETWORK.” Dang! Who might that be?

The subheading said “CITY OF LANCASTER, SCHOOL DISTRICT POLICE DEPARTMENT BEGAN USING COPSYNC THIS SCHOOL YEAR.”

So, which one is it? The City of Lancaster? The Lancaster ISD? Both? It would appear to be both. Until you read deeper where after a confusing “The City of Lancaster Independent School District,” paragraph (an animal that does not exist) speaks only about LISD. I contacted the City of Lancaster Police Chief to confirm it is LISD but not the City. Honest mistake? Maybe. But strange for a company born in Texas and is being raised in Texas by Texans.

Red Flag.

Being a numbers person is both a blessing and a curse. When a stock price gets too high for some investors, it is not unusual to have a 2:1 or 3:1 split. The reverse is also true. You have to be a certain size stock price to be traded on the primary exchanges or be eligible for the big institutional buyers. However, on October 13, 2015, CopSync announced a 1-for-50 reverse stock split. Wow! Now, that will get your attention.

However, all did not go well apparently. This penny-stock only reached a high of $9.55 between when the CopSync shareholders approved the reverse split and when it became effective. But what happened after the peak of $9.55? As you can see from the chart below, the CopSync stock has steadily declined to a low or $0.70 on October 6, 2016. Since then it closed at $0.7780 last Friday. That doesn’t look very promising.

copsync

Bigger Red Flag.

What do the stockholders know that most people do not know, including the purchaser of CopSync’s goods and services? I was also puzzled by the CopSync news alerts that appeared to be nothing but good news. I saw a headline that said CopSync’s Gross Profit Margin was 29.00%. That’s when I started doing some digging. In fact, I went back to the beginning and started comparing financial statements and SEC filings for the last ten years. I was more than a little shocked. It is not at all unusual for a start-up company to have a few years of losses.

To be sustainable (a “going concern” in accounting vernacular), a business must eventually make a profit unless two things happen: 1) somebody loans them money from a bottomless well and/or 2) stockholders keep putting money in the company in hopes that they will not only get their money back but make a profit.

Since 2008, CopSync has had revenues of $28,989,455 and Cost of Revenues (mostly hardware and software costs) of $21,256,922 for a Gross Profit of $7,732,533. But that is just the first line of value on the Income Statement. Yep, if you are going to choose one number to highlight, there you go.

But wait, as the late night Veggie-Matic commercial goes, there’s more. There are three big other expenses for General & Administrative, Research & Development and Sales & Marketing. These three big guys have totaled $36,292,758 since 2008.

That means the Loss From Operations totaled $28,560,225 since 2008! Another deduction for Other Expenses such as Interest Expense totals $4,139,400 for a total loss since 2008 of $32,699,525.

How does a company that has a Net Loss of $32,699,525 since 2008 stay in business? Especially when the losses from 2012 through 2015 are -$4,287,930; -$3,839,856; -$4,328,467; and -$6,505,422. And then it gets worse as the first six months of 2016 show a loss of -$5,314,063.

The answer to that question is a variety of loans from vendors, owners and spouses of owners. There is even a footnote about a big loan from the Pharr, TX EDC that was later hoped to be turned into a grant. Vendors have apparently been paid in stock.  There is a much larger part of cash that has come from additional stock issues and the stock Uplist, presumably from the reverse split.

Conclusion.

My concern is not about CopSync. I hope they make it, but I personally don’t see how the financial arithmetic is going to work out. If their plan is to sell their base of customers to an outside firm, it would seem to me that income from the sale of equipment and services is going to have to double to break even.

If CopSync is hoping to land the big one – as their PR suggests – then two questions come to mind. Are they planning to price their incremental services to subsidize the current base of small guys? Also, there are absolutely tons of stories in the business world of companies that are doing well (making a profit) at a certain level that then collapse when they jump to a higher scale of business. Are they geared to make that happen? If it happens?

My concern is for the 530 (or whatever the number is) of agencies, mostly in Texas if CopSync can’t continue to get funding. If fact, I can’t imagine what group of knowledgeable stockholders would put $30+ million into a company that is losing money big time – and with losses that are growing.

I actually don’t understand how CopSync has withstood the eye of the SEC and even the NASDAQ? And even the securities’ analysts that supposedly rate CopSync. Are they independent? I read the transcript of a recent earnings conference call and the questions seemed like softballs considering a company that is losing so much money.

In any case, for any of my readers considering CopSync products, kick the tires on their products and services to be satisfied there is a good fit. But also ask about how they are going to turn around multi-million dollar losses year after year. LFM


Are We Chasing Our Re-Tails Too Much?

Are We Chasing Our Re-Tails Too Much?

By Lewis F. McLain, Jr.
President, CityBase.Net
lfm@CityBase.Net

Introduction.

The borders for Retail shopping are disappearing with the exponential increases in online sales. My wife is within a fraction of a percentage point of buying all of our Christmas items online. In fact, we’re close to 100% of all purchases being via the Internet with the exception of food. The red flag was actually raised a few years ago as not just old malls, but relatively new malls have been torn down. We don’t even have time to get nostalgic about a mall before they head toward bankruptcy or the wrecking ball. Worse, when blight attacks strip centers way before the neighborhoods around them, we have a different world to face. You know things are different when there is a Web site called http://www.deadmalls.com.

I’ve been intrigued with the number of studies being conducted in search of Retail Leakage to adjacent communities. We even have all kinds of illogical connections being made in my own City of McKinney where a mayoral candidate is convinced that if we create a Restaurant Row, businesses will be beating down our door to move to our swell town. This is a particularly bizarre movement since McKinney is not without restaurants, and many of them are in areas that fit the definition of a Restaurant Row.

When lunching with a colleague recently, our conversation turned to this concept of chasing pretty things like Retail. His community has an exceptionally large portion of warehouses. You know, those ugly boxes. Those boxes that have a very attractive amount of property tax revenues with a minimal amount of demand on public services. However, if you look closer, there is also an impressive amount of sales taxes that may be associated with inelegant structures in your city.


Let’s Look At Some Data.

Below is a recap of Texas cities with a population of greater than 50,000. It is helpful to look at these kinds of numbers before you get dizzy with excitement over some study numbers that give the impression that there are $billions within your grasp if only you know who to chase. You don’t need to spend a lot of money to get a relatively good picture of where your expectations might be reasonably placed. The average of these cities below is $185.94 on a per capita basis placed on a one-penny equivalent. The median is $169.82 on the same basis.

Yes, there are some wide variances. And without a doubt the main consumer-driven sources make a difference. However, don’t overlook that some of the above-average results are coming from cities with a large portion of business- driven transactions. Remember that the actual correct label is not just Sales Taxes; it is Sales & Use Taxes.

The bottom line is that you need both to have a healthy income stream for both Sales Taxes and Property Taxes. In all cases, realize that there is just so much that can be squeezed out of the consumer. And when squeezed too much (credit cards, HELOCs), a painful recoil is just a matter of time. Before you celebrate that a new Kroger has just opened, realize that you might be seeing an equivalent size grocery store closing within a couple of years. You might be just seeing a zero-sum situation except now you have to figure out what to do with an empty grocery store.

c1


Where did I get the Consumer/Business allocation data? Actually, from two places. Similar but different. The first review was from the top level categories as compiled by exact information I have from over 25 cities of all sizes (total population of about 3.5 million in population and with collections of about $872 million in the last year) across the state based on NAICS codes that I have cleaned up. By cleaned up, I mean that many of the codes used by the State are in error. Apple Stores, for instance are classified as Manufacturing vs Retail.

A summary of the scrubbed data is in the table below. To no surprise, the dominant consumer categories are on top. However, you might be surprised at the level of sales tax that comes from Wholesale and Manufacturing and others.

c2

Second, I took each of the cities in my first table and allocated into Consumer vs Businesses groups based on data that can be obtained from the state for all cities and then used my judgment to allocate. It is not scrubbed, but the accuracy should be sufficient to make a meaningful comparison. My allocations are in the table below. No doubt you and I might allocate the Categories a little differently. However, this is the best I can do with the public data I have.

c3

Conclusion.

It seems pretty obvious to me that many cities may be chasing the wrong things for sales tax purposes. It is acknowledged that I am focused only on sales taxes and not the production of property taxes nor on the number pf pure jobs and the pay levels for jobs. I can’t resist being Captain Obvious here by saying go for everything that helps provide a healthy balance in your revenue base.

However, now that Amazon and most of the prominent companies do in fact collect sales taxes and remit based on the city from which the order is placed, the potential for a city to get a substantial amount of retail sales taxes whether you have a business located in your jurisdiction has changed in your favor if you care to have your citizens’ money out of pocket coming back to their home city.

Don’t overlook the other Categories that are likely to generate a substantial amount of revenue and actually be more stable over time. LFM


Is Texas Charging A Hidden Tax To Local Governments & Citizens?

Introduction.

I fully understand that all local governments (counties, cities, transit authorities and special districts) in Texas are subdivisions of the state. One way to look at that fact is say everything you have, children, is because we gave it to you out of our generosity. Be grateful, stop complaining and leave me alone.

But that is not how I see it.

Local governments are taking a beating from the State in many ways. In small General Law cities (under 5,000 population), the State says we will give you the Charter. You can’t do anything unless the State law says you can. In Home Rule cities (mostly those over 5,000), the State says you can do anything you want unless the State law specifically says you can’t.

Perhaps with at least some justifiable reasons, the State continues to take away local control from cities. Their actions are actually pretty insulting in that the treatment is as if the cities aren’t accountable to the local voters. Again, you are too dumb and evil to be trusted, local governments, so we have to step in to throttle you back as we see fit for the sake of your citizens.

The net result involves several areas of constraints, but the biggest is revenue caps. If we can cut off your oxygen, local governments, we can reform you into good soldiers in our self-professed image.

It’s Two-Faced.

This blog is about an example of how the State is two faced. The mantra is taxes are bad. Actually, that translates into your taxes are bad, local governments, but ours are okay. In fact, here is a deal for you, ungrateful local governments, we will let you charge a sales tax up to 2.00%. This will be added to the State sales tax of 6.25%. Oh, by the way, even though we are collecting sales taxes for us anyway, we will collect and remit your portion. For this privilege, we will charge you 2.00% of your take. We will call it a service fee.

A fee implies there is some rational nexus (logical connection) to the effort it takes to provide a service. Logic would say that the State should charge the local governments about 2.00%/8.25% of the actual cost of the service. The State would recognize (in a logical business setting) that the State’s portion to bear is 6.25%/8.25%.

If the amount paid by local governments is well above the cost of services, then it is a tax.

Whoa, buddy! There goes that nasty word.

So are you saying, Lewis, that the State is taxing the local governments and their citizens?

Well, Let’s See.

Do we want to look at the State’s true cost of service first or the amount that is taxed by the State to the local governments?

I have tried to get the actual cost of service for the Sales Tax Division from the Comptroller’s Web site. It does not appear to be separated. There may be a good reason for that. If you can get me a good number, please send it to me.

Meanwhile, let’s approach this junior high story problem a different way. How much are local governments paying to the State for collecting the local portion of sales tax? I am so glad you asked, because I happen to have that number to the penny.

In the last 12 months, the local governments have paid the State $164,148,777 to handle those collections. In a fair cost allocation model that would mean the entire cost is $164,148,777 divided by 2.00% times 8.25% or $677,113,707.

Do you think it costs the State $677,113,707 to collect sales taxes every year?

I don’t either. To say that is a lot of money is the understatement of the century.

Conclusion.

So, if our State leaders are so emphatic about cutting taxes for the citizens of Texas, as all of their campaign rhetoric states as well as the continuing mantra they chant to local governments, why not do the noble thing:

1)     Determine the real cost of service for sales tax collections.

2)     Charge local governments for their proper share, which is the simple calculation of 2.00% divided by 8.25%.

Otherwise, the State of Texas is imposing a tax disguised as a cost-based fee to the citizens of Texas.

Below is the recap of the annual tax charged to local governments along with the Top 50 payers.

ENTITY GROSS COLLECTIONS 2% SERVICE FEE
GRAND TOTAL

$8,207,438,785

$164,148,777

HOUSTON MTA

$706,588,797

$14,131,776

HOUSTON

$649,877,508

$12,997,550

DALLAS MTA

$549,512,086

$10,990,242

SAN ANTONIO

$326,024,050

$6,520,481

DALLAS

$286,439,874

$5,728,797

AUSTIN MTA

$224,847,374

$4,496,947

AUSTIN

$207,111,910

$4,142,238

SAN ANTONIO MTA

$139,467,030

$2,789,341

FORT WORTH

$139,043,247

$2,780,865

ARLINGTON

$103,856,316

$2,077,126

EL PASO

$84,544,840

$1,690,897

PLANO

$79,127,702

$1,582,554

FRISCO

$76,561,830

$1,531,237

AMARILLO

$76,188,475

$1,523,770

CORPUS CHRISTI

$73,886,344

$1,477,727

FORT WORTH MTA

$69,078,582

$1,381,572

ROUND ROCK

$67,996,147

$1,359,923

LUBBOCK

$66,316,817

$1,326,336

IRVING

$66,009,062

$1,320,181

FORT WORTH CRIME CTRL DIST

$65,433,451

$1,308,669

SAN ANTONIO ATD

$63,220,054

$1,264,401

MCALLEN

$61,739,232

$1,234,785

MIDLAND

$54,979,855

$1,099,597

SUGAR LAND

$53,198,028

$1,063,961

GRAND PRAIRIE

$51,143,821

$1,022,876

MCKINNEY

$46,632,047

$932,641

EL PASO COUNTY

$45,826,233

$916,525

MESQUITE

$43,412,130

$868,243

GRAPEVINE

$42,358,646

$847,173

CONROE

$42,325,549

$846,511

EL PASO CTD

$41,951,196

$839,024

ABILENE

$41,233,710

$824,674

TYLER

$40,309,897

$806,198

ODESSA

$39,931,872

$798,637

BEAUMONT

$39,684,062

$793,681

LAREDO

$39,468,031

$789,361

ALLEN

$37,741,460

$754,829

WACO

$37,621,206

$752,424

BROWNSVILLE

$37,556,119

$751,122

LEWISVILLE

$35,782,795

$715,656

CARROLLTON

$35,274,253

$705,485

RICHARDSON

$33,472,183

$669,444

COPPELL

$33,098,877

$661,978

CORPUS CHRISTI MTA

$32,885,321

$657,706

PASADENA

$32,755,524

$655,110

MIDLAND COUNTY

$32,588,281

$651,766

ECTOR CO HOSP DIST

$31,148,828

$622,977

BRAZORIA COUNTY

$31,121,946

$622,439

DENTON

$30,871,972

$617,439

LONGVIEW

$30,430,549

$608,611

Approved As To Form But Not Legality

I’ve been baffled over the years. Why do city attorneys sometimes sign ordinances and contracts “Approved as to form and legality” and others leave off the last two words? My sensitivity increased about 25 years ago when a city manager told me he didn’t ask the question but rather told the city attorney he wanted to include “and legality” on the signature block. The city attorney complied. Reluctantly.

Why would a city pay so much money for an attorney to draw up a legal document or to review a legal document and then not declare it as “legal” if the document is being declared to be in “form,” which one might assume to be in good legal form? Can a legal document be in legal form and not be legal? I suppose it could. If nobody is claiming it is legal.

A signal would be a challenge by someone suing the city for having an illegal document approved by the city council. I can just hear a city attorney saying to the council: “look, I never said it was legal. I just said it passed the legal-pretty test.”

But a red flag in my mind would be when the city attorney has reviewed a legal document where the author placed in the signature block “Approved as to form and legality” and then the city attorney or someone later changed the legal document to take off the last two words? Would that not make you wonder why an attorney would deliberately remove those important words?

That’s exactly what has happened at McKinney. The typical signature block in McKinney only includes the words “Approved as to form.” So at the next council meeting, there is an ordinance amending a previous ordinance involving two MUDs in McKinney’s ETJ. The MUDs want the ability to issue up to $262,800,000 in bonds when they already have the ability to issue $120,000,000 from the City before asking for more. They also want to automatically add more MUDs without having to bother the Council again.

Lastly, they want to have the cap adjusted 3% annually without further approval. That means the lid will be $353,181,225 in ten years before the development is built out. And this does include the refunding of the original bonds. With interest rates of 3.3% to 4.0% for the MMUD’s 2016 Bonds, you can be assured this will churn out a ton of business to the bond issuance community. What the heck, 29.1% of the $13.8 million issued is all going to soft costs rather than hard assets. MUDs are all about helping the developer and all of the supporting players engineering and debt issuance players.

I have already blogged about this particular MUD. Since then I  have driven through the MMUD. The first thing that caught my eye as you approach Trinity Falls is the huge elevated storage tank that has the same McKinney logo. There is no conspicuous sign that says the development is in a MUD, so it looks and feels very much like you are in McKinney. BTW, that water tank is not McKinney’s! In fact, I called a realtor who has been doing business in McKinney for many years. She said TF is in the City of McKinney. I said that it wasn’t. It’s in the ETJ and has a $1.05 tax rate. And there is virtually no legal limit on how high the tax rate could be raised. She knows me quite well but was certain that I was wrong since the MLS listing has the properties in the McKinney postal code designation.

While the houses appear to be cheaper in this MUD, the fact is the price is similar and could be more than the same house in McKinney. They are just paying part of the cost in their mortgage and part in a tax rate. It should be entertaining when they go back and re-read the documents they signed when they bought the house. But good luck if they want to complain to the City.

I am guessing if you walked down the street and knocked on the couple of hundred doors of occupied residences, you would find out most people think they are in McKinney. I dare the Council to send a staffer to take a survey! If they were to watch the last McKinney City Council meeting when this amendment was tabled, they would see that Councilmembers are on record as confirming it is not in the City and that from their viewpoint it is not likely to ever be in the City. The historical tug-of-war between MUDs and cities is that the MUDs want to be taken over when their debt is high and their tax rate is high. Just the opposite for cities.

But our City Council is pretty good about not asking too many questions when it comes to helping out a developer and is likely to rubber stamp this approval next week.

Also, this blog is about amending an agreement involving huge amounts of dollars with the appearance that the City Attorney does not want his signature on it if he has to vouch that it is legal. Don’t count on the Good Ole Boy Network, of which the City Attorney is a full-fledged member, to do anything about it. I’m surprised it is not on the Consent Agenda. However, there is no public hearing. It will be a drive-by item.

Besides, it’s in legal form. LFM

Who Is Monitoring McKinney Municipal Utility Districts?

McKinney Municipal Utility District No. 1 (MMUD1) is the legal subdivision of the state located in the City of McKinney’s ETJ but not in the city limits as of now. I am going to refer to it as MMUD(s) because documents refer to MUD1 and MUD2, but MUD1 is the Master District. The City has control of a number of construction requirements and is party to an agreement that allows the City to even contract with the MMUD for the City to provide certain services. MMUD was created in the 80th legislature in 2007 by Rep. Jodie Laubenberg as HB 3979.

This MMUD is also the entity involving the Trinity Falls Development. From everything I hear, the Developer is experienced with these kinds of financing vehicles. This blog is not about the developer per se. It is about MUDs in general and the MMUD as an example in particular. MUDs are about helping the developer get a project financed. MUDs are in abundance in the Houston area. Missouri City, as an example, has 25 MUDs in their city limits. MUDs are not so popular North Texas. And for a reason. Take a poll of the Houston area cities with MUDs and ask if they could undo the MUDs today if they could?

MUDs help with leapMMUD-frogging development. Leap-frogging is not a positive term. In many cases it means allowing islands to be created. Everybody knows that the best growth management is in contiguous concentric circles, but that never happens like the textbook pictures. There are always people wanting to get away from the city where land is cheaper. And almost always the growth fills in between until the outlanders become just like the city, too.

In the map below from the Municipal Advisory Council (MAC), it shows Collin County in green, McKinney ISD in blue and MMUD in pink. MMUD is 880.42 acres in size. In other disclosures, the Trinity Falls property is shown to be 1,700 acres. Therefore, one must assume that MMUD could expand. I have heard that there will be a MUD3 and MUD4 at some point in time.

The purpose of the MMUD is to sell bonds to pay for the infrastructure (and substantial other costs) put in place by the Developer. By infrastructure, it is meant to be roadways as well as water and wastewater lines. How much in bonds are anticipated? That becomes a very interesting question. We turn to their bond disclosure documents to understand. MMUD shows the authorized debt to be as follows:

$133,050,000  Roadways.
$145,000,000 Water & Sewer System.
$  10,240,000 Fire Protection Related.
$288,290,000 Total Bonds Authorized.

You are probably asking if this could be correct? It’s going to take $288,290,000 to provide infrastructure for 880 acres of mostly residential development?

Again, we look to official documents to understand. As it turns out, they show only 680 acres of development, and it is all residential. The remainder is for parkland, an elementary school or is undevelopable.

Unless you’ve beat me to it, then $288,290,000 divided by 680 acres is $423,956 per acre. Based on an average of what they have disclosed so far, the average lots per acre is 2.935. That would mean the bond authorization placed on a per lot basis is $144,443 per lot!

Before we go further, it is important to realize that bond authorization does not mean they will sell that much in bonds to repay the developer. However, the significance is still there, and I guarantee you $144,443 is probably not a number shown to the McKinney City Council or that staff bothered to calculate or that the council bothered to ask.

So What If The Lot Cost Is Very High?

You can say that if the buyer wants to purchase a house that has $144,443 in it before any vertical construction begins, then that is their business. But that is why we must dig deeper. If it goes into the value of the house, then you know the full cost. However, homeowners in the MMUD must be on their toes to realize the cost of the house they pay to the builder is only part of their costs.

In addition, they have to pay a MMUD tax that covers the $144,443 per lot:

House Price Paid by Mortgage.
+Infrastructure Paid by MMUD I&S Tax Levy Paid.
= The Full Cost of the House & Property.

The MMUD tax is the issue that can become troublesome. Take a poll today of the MMUD occupants and ask if they understand the MMUD taxes?

How Much Is The MMUD Tax?

There are two parts to the answer. The first is how high could the MMUD Tax be. The McKinney ISD has a maximum rate that is very high. It is a total of $1.67 per $100 value. That is broken down into Maintenance & Operations (M&O) of $1.17 and $0.50 for Interest & Sinking (I&S or Debt Service). Both components are at the maximum the state allows.

The City of McKinney’s tax rate, although not charged to the MMUD property owners, is $0.5830 with $0.4100 being for M&O and $0.173 for I&S. It is nowhere near the maximum allowed by state law.

The MMUD is quite different. The M&O maximum tax rate is $1.20. However, there is no limit on the I&S portion of the tax rate. Therefore, there is no legal limit on the tax rate.

However, the question first at hand is what is the current MMUD tax rate? The answer is $1.05 per $100 broken down into $0.505 for M&O and $0.545 for I&S.

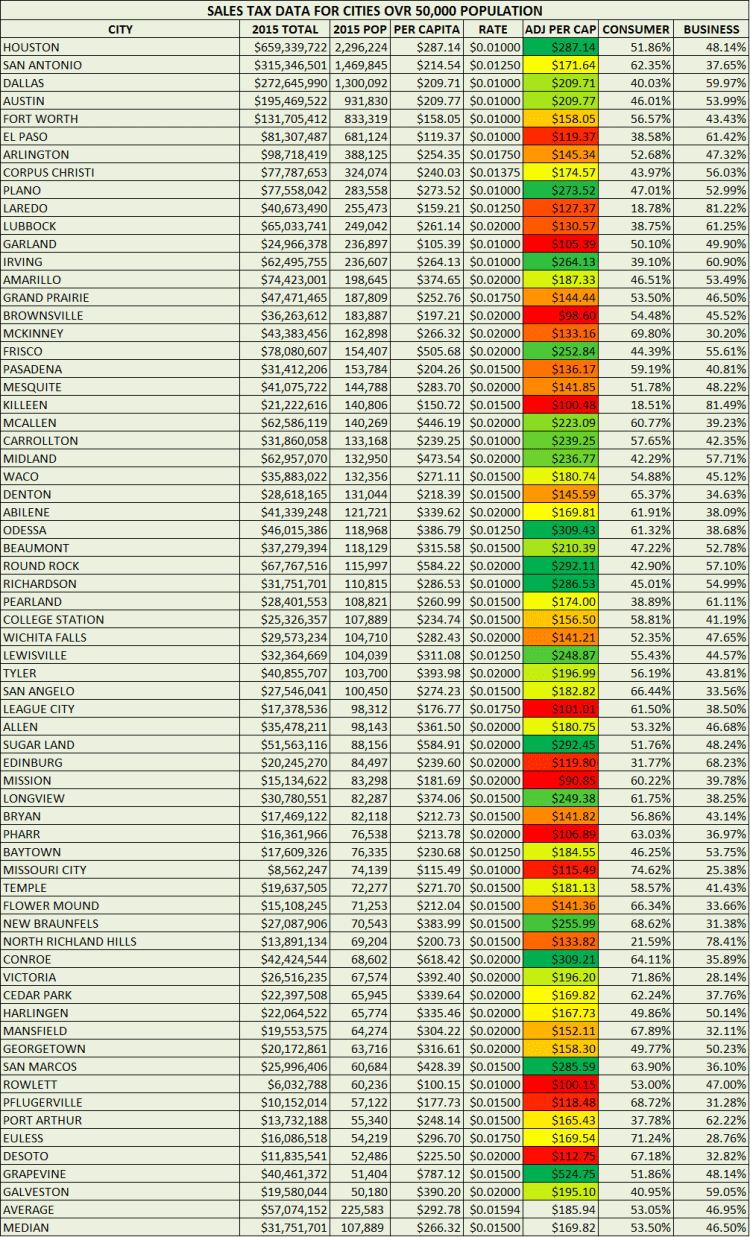
Therefore, if you live in the City of McKinney, the total tax rate is $0.5830. If you live in the MMUD, the tax rate is $1.050.

Okay, So What?

Your next thought might be the same as mine, and that is won’t the house price and taxable value of the house reflect a lower amount since part of the home is financed out of the mortgage and part out of the MMUD tax?

Let’s check. One MMUD home on Sabine is valued at $397,392. The land value is $80,000 for the lot, and the improvement value is $317,392.

The lot is 7,500 square feet or $10.67 per sf. The improvements, based on 3,612 sf would be $87.87 per sf. for a total of $110.02 per sf when the total value is stated on the main area of 3,612 sf.

What do you think? Discounted or not?

Of course, these are Collin County Appraisal District values and not the actual purchase price. The purchase price could have been lower. Or higher.

It must be mentioned that these are the market values as shown by CCAD before any exemptions are taken into consideration.

What We Do Know.

The total tax bill on the example property, before exemptions, would be $3.03696 per $100 when adding in the MISD ($1.67); Collin County ($0.235); College District ($0.08196) to the MMUD’s rate of $1.05.

These are the current year’s rates. The tax rolls will not be certified until July 25, 2016 for the tax bills mailed October 1, 2016 and due January 31, 2017. So sometime between July 25 and October 1, the MMUD will be setting their tax rate for the bill to be mailed by October 1. It could be the same or lower. There is virtually no ceiling on the topside.

When the tax bill is received (again, before exemptions) of $12,068.64 ($397,342 x $3.03696 / $100), the homeowner will realize what they have bought into by being in the MMUD.

Were they told of the MMUD tax potential at the closing of the purchase? Oh, yes, they signed a document along with dozens more when they were just hours away from getting the key. The tax bill may have been incorporated into the mortgage, so the homeowner will have a wake up call to examine their escrow every year when insurance and taxes possibly change. A fully informed potential buyer would be educated when they drove into a subdivision of MMUD. I drove around this morning and didn’t see a sign.

Lewis, Why Do You Care If The MMUD Homeowner Gets Riled?

I don’t. My concerned being raised is about the City of McKinney. Maybe even the County/CCCD. If you read through the documents, you can find quite a bit of language that says, read our lips, the City and the County are not responsible for the debt and payments of MMUD. But you would be quite naïve if you think there are no repercussions.

First, I don’t like it that the MMUD has the name “McKinney” in it. If there was ever a MMUD default, the headline would not be favorable for the City. Also, the history of MUDs all over the state is for the homeowners to get restless or irritated with a dose of buyers’ remorse once they realize their tax bill would be lower by $1,846.68 annually ($1.05-0.5853 x $397,392 / $100) if they lived in the McKinney city limits. Take a poll of the highest tax rates in Texas and you will find mostly MUDs at the top of the list.

If the MMUD homeowners believe they got duped paying a competitive price for their house plus a tax rate that included part of their house (meaning they paid twice for part), then embarrassment turns into rage. Especially if they can’t sell their house to escape the burden. Before long they may start wanting to run for City Council to force the absorption of the MMUD by the City AND to absorb the outstanding debt at the time. It HAS happened across the state. If they see that the City is part of the agreement and had plans to incorporate the MMUD, then why not now?

What About The Debt?

Now we are getting to the guts of the matter. The tiny little MMUD has been authorized to issue, $288,290,000 in bonds supported only by the property owners of MMUD. They have issued only $13,800,000 to date in two issues. However, they are ramping up in that $8,070,000 was dated September 1, 2015 with a secondary issue of $5,730,000 dated February 1, 2016. The race is to sell debt as fast as possible to reimburse the developer when there is value on the ground to carry the debt service.

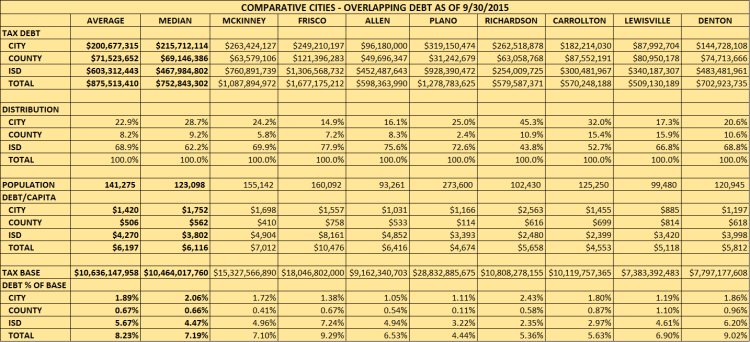
For a perspective, the entire outstanding debt for all of Collin County is $379,084,150! For all of the City of McKinney, the outstanding tax related debt is $307,790,000!

Do you see my concern?

Can the City of McKinney control the issuance of more debt until they have confirmations there is not going to be a negative impact on the City, legal, public relations or other? The answer is yes and no.

By contract, the City has placed a cap of $120,000,000 of debt issuance on MMUD unless they approve to raise the level.

So, Lewis, why don’t you shut up and wait until a problem crops up? First, I’m not geared that way. My entire career has been about worrying over things that could blow up. But the real reason is that I was waiting for the audited financial statements for the MMUD for their fiscal year ending March 31, 2016.

Then something happened on the way to the wait station.

The McKinney City Council shows a workshop agenda for tomorrow night and a Council meeting agenda item on Tuesday night to amend the 2012 agreement. McKinney does a horrible job of providing background before a meeting as I complained about in my last blog. First, they claim the amendment resolution preamble is in the best interest to the City. Quite noble, but they don’t explain the benefit. In fact, there is no staff paper, no real back story, no staff recommendation.

What the amendment does say, to me, is that MMUD is being given permission to raise the debt issuance limit to $262,800,000!

Why in the world if there is already a $120,000,000 cap with only $13,800,000 issued would MMUD need to lift the cap right now?

And nobody seems concerned that all debt issuance and taxes entity have a bearing on each other. A $million of debt uses everybody’s debt capacity. A penny tax increase is a penny of taxing capacity the resident can afford.

Conclusion & Recommendation.

I am concerned how we allowed a MUD to get created in McKinney in the first place. Yet bigger, since we are only about 50% built-out and tens of thousands of acres left to be developed, how are we going to say no to the next Houston-style method of incentivizing a developer? In fact, why are we incentivizing residential development at all? In addition to allowing the MUD financing vehicle, the City is granting a sales tax split to MMUD!

I am requesting of the City Council that this agreement amendment be postponed until the middle of July when the audited financial statements should be finished as well as the certified tax roll be delivered.

More importantly, I suggest the City Council require a five-year plan be provided to the City Council when additional bonds are issued and made a requirement for City approval to go forward with future bonds. The financial plans should show the lot and construction pipeline as MMUD already discloses now to bond holders in their official bond issuance statement. The plan should also show the tax value assumptions, the debt issuance/debt service assumptions as well as the tax rate component forecast for the next five years. It is with 100% certainty that MMUD has this information.

In fact, the bond rating agencies would be insisting to see this information. Except there is one problem: these bonds are not rated nor or they guaranteed by a bond insurer. And there is a reason for their absence. Only very sophisticated buyers would be interested in these bonds. And there is a premium they earn for the risk. Take a poll of the interest rates on these and other MUD bonds compared to typical tax supported bonds.

At this point, I am not suggesting that toothpaste can be put back into the tube. However, the MMUD board meetings should be held in McKinney and the City needs to be involved in monitoring. The MMUD now shows bookkeepers, financial advisors, bond attorneys and auditors all being from Houston. They are very smart people with absolute perfect knowledge of how MUDs work. I have to wonder if the City of McKinney asked their own financial advisors and bond attorneys the pros and cons of allowing a MUD to be created in the ETJ? Who did the due diligence on this proposition from the beginning and since the inception?

Ironically, they show Chandler Merritt, Public Works Director of the City of McKinney, as a finance-connected official according to the Municipal Advisory Council. Go figure!

Lastly, it should be noted that 29.1% of the $13,800,000 in bond currently outstanding went toward soft costs (legal fees, financial fees, capitalized interest and other non-construction costs). There is an entire cottage/mansion industry in Houston related to MUDs. We really need to think long and hard about the potential for MUDs to proliferate in North Texas.

Nobody thinks through how these animals end, but there are many stories of ugly exits as they take on a life of their own and want to be absorbed when it is in the best interest of the MUD. But my overriding concern is that a council known for making decisions without full public disclosure really needs to monitor the MMUD and any MUD in the ETJ. LFM


We Can Learn From Comparative Data

[Note: this blog has been updated to correct an error in the table and also to expand the table to be more informative with the breakdowns between cities, counties and school districts. The overall message is generally the same, but a few specific comments have been updated. LFM]


It will be best if you read yesterday’s blog before delving into today’s information.

Introduction.

Sometimes it can be dangerous to start comparing one local government to another. Part of the reason is that no single piece of data can tell a complete story. The other part is a fairly compelling argument that you must understand a lot about all of the cities in the comparison. There always will be outliers. At the same time, you will tend to see norms forming as certain ratios begin to cluster. And it is the ratios that are absolutely necessary to see. Ratios are the equalizers, or as close as we can make the data reveal a story.

First, you must select relatively meaningful entities to compare. Two common criteria are size and proximity. Below I have compared eight cities using those guidelines. Four are very close in size regarding population. Plano is included due to proximity to McKinney. I might have omitted Lewisville and even Denton except they are close in size, and Denton is a county seat city. Taken together, they perhaps form a nice U-shaped, contiguous configuration that starts and ends with McKinney and Denton in alignment with Hwy 380 to complete the horseshoe.

Comparison3

Building on yesterday’s blog, we have now enhanced our knowledge base considerably. I intentionally wanted you to focus on just the underlying approach and to be hungry to see how McKinney compares with a meaningful sample as presented today.

The absolute dollars are interesting but the least helpful in comparisons until you view the data on some common basis such as the percentage distribution. The average/median is 22.9/28.7% for the cities, 8.2/9.2% for county related and 68.9/62.2% for school districts. To no surprise after learning about the domination of ISDs yesterday, McKinney is well above the average and median. But let’s look deeper.

On a Per Capita basis, McKinney is quite high at $7,102 second only to Frisco with $10,476. Plano is the outlier on the lower end of the spectrum.

On the other key metric, Debt as a % of Taxable Values, McKinney is the third highest, with Frisco and Denton quite a bit higher.

So, What Are Our Takeaways?

There’s actually quite a few.

  • We have confirmed that the school districts dominate in debt in just about every comparison.
  • We have shown where McKinney is significanly higher than most of the cities we might use for comparison purposes in an effort to establish a “norm.”
  • As a burden on city taxpayers, McKinney’s load due to ISDs (McKinney ISD, Frisco ISD predominately), is noteworthy.
  • It is possible that we have spotted a cost differential with Frisco ISD’s policy of more but smaller high schools versus Allen ISD’s single high school. Not sure, more digging required to explain any outlier. What we also don’t know is the school building unused capacity for any of the school districts.
  • We may have also spotted a high % of the tax base for debt in Denton due to the combination of so much non-taxable property with two large universities as well as county facilities. Again, validation requires some digging.

The Bigger Hidden Story.

Even well-managed city cannot control the other local governmental entities. Also, in many cases, counties, cities and school districts don’t talk to each other any more than they have to. In fact, many overlapping entities stay at odds with each other. Even though they serve the same taxpayers.

This friction becomes obvious to people like bond rating agencies having to evaluate each entity in light of one taxpayer and the vast number of bond holders. If the bond rating agencies and the citizens could huddle in one spot and deal with this one question, what do you think the outcome would be?

The Question: what could be done regarding debt and tax rates that would be the best for the citizens and the bondholders regarding affordability, ability to pay and willngness to pay?

The Possible Answer: Develop a policy that sets some parameters so that we can see the picture as a whole. For debt, the amount cannot exceed a total of $________ per capita with no more than $____ going to the county, $______ going to the city and $______ going to the school district(s).

Can you see how that is not so hard to do when you put comparative data in front of intelligent people willing to serve the people? Financial policies can be formulated, adopted and then revisited annually to affirm a gyroscope is in place to assure responsibleness. Can you imagine a set of policies everybody can articulate?

Conclusion.

Okay, okay, climb back over your pew and sit down. Even the bond rating agencies don’t like caps that could threaten the ability to repay the bond holders and to disrupt the operations of the local governments. I’m just trying to convey that more and more attention is being given to data-driven decisions. There is a maximum limit out there somewhere. Some say there is room to go. Others say were are there right now. Yet others say we have passed the limit. Can you put a number on it? I can. And you can, too.

Here is what we know. We (public officials and citizens) either self-police or else we risk somebody imposing a lid on us. In fact, did you know there is a traveling senate committee going around the state armed with data they are misusing to basically be prepared to stifle local governments’ ability to decide? We have prominent state officials elected on the promise they would try to eliminate property taxes? They had much rather “clean up” local government than to face their own egregious mishandling funds at the state level.

But heed the warning. Even today another story came out about Garland ISD missing the cost of a $20 million natatorium the voters approved by $10 million!

We are violating the principle of taking care of the basics and, if possible, do a few frilly things. In fact, the optional things that allow an elected official’s name on a building plaque are coming ahead of the crumbling streets and school buildings in many cases. More on that topic coming up. LFM