Are We Chasing Our Re-Tails Too Much?
By Lewis F. McLain, Jr.
President, CityBase.Net
lfm@CityBase.Net
Introduction.
The borders for Retail shopping are disappearing with the exponential increases in online sales. My wife is within a fraction of a percentage point of buying all of our Christmas items online. In fact, we’re close to 100% of all purchases being via the Internet with the exception of food. The red flag was actually raised a few years ago as not just old malls, but relatively new malls have been torn down. We don’t even have time to get nostalgic about a mall before they head toward bankruptcy or the wrecking ball. Worse, when blight attacks strip centers way before the neighborhoods around them, we have a different world to face. You know things are different when there is a Web site called http://www.deadmalls.com.
I’ve been intrigued with the number of studies being conducted in search of Retail Leakage to adjacent communities. We even have all kinds of illogical connections being made in my own City of McKinney where a mayoral candidate is convinced that if we create a Restaurant Row, businesses will be beating down our door to move to our swell town. This is a particularly bizarre movement since McKinney is not without restaurants, and many of them are in areas that fit the definition of a Restaurant Row.
When lunching with a colleague recently, our conversation turned to this concept of chasing pretty things like Retail. His community has an exceptionally large portion of warehouses. You know, those ugly boxes. Those boxes that have a very attractive amount of property tax revenues with a minimal amount of demand on public services. However, if you look closer, there is also an impressive amount of sales taxes that may be associated with inelegant structures in your city.
Let’s Look At Some Data.
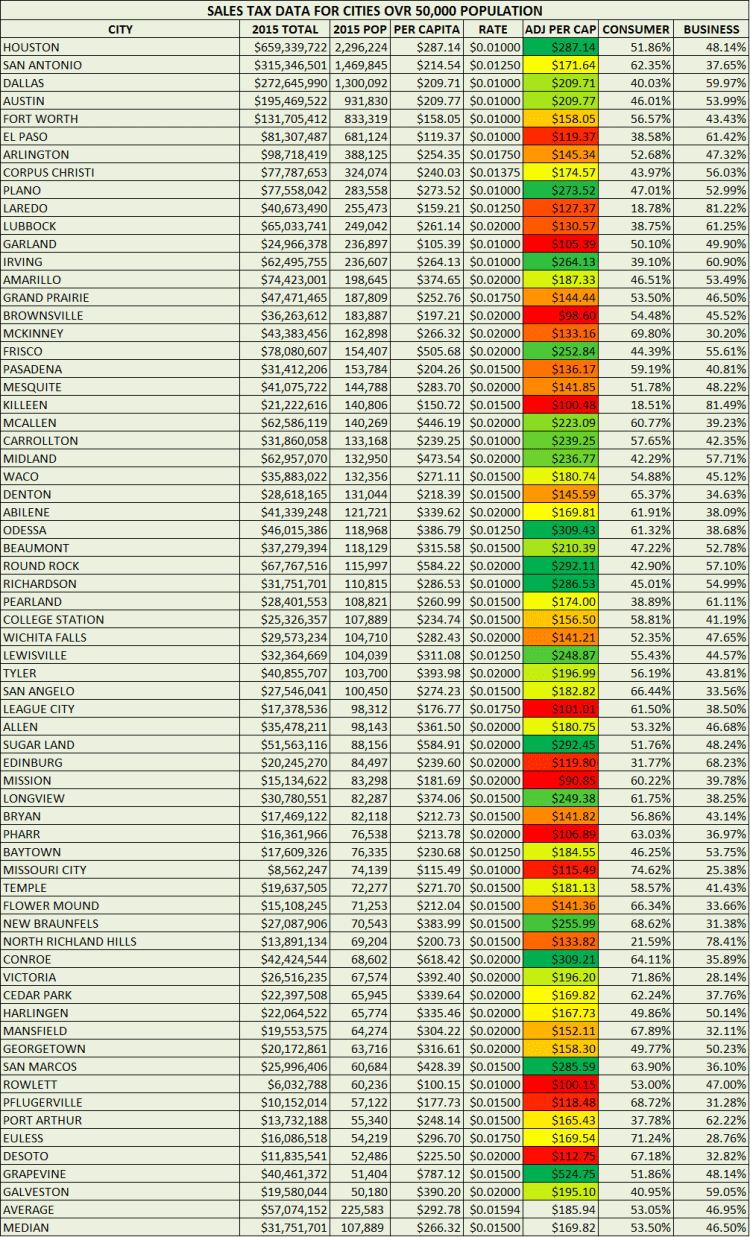
Below is a recap of Texas cities with a population of greater than 50,000. It is helpful to look at these kinds of numbers before you get dizzy with excitement over some study numbers that give the impression that there are $billions within your grasp if only you know who to chase. You don’t need to spend a lot of money to get a relatively good picture of where your expectations might be reasonably placed. The average of these cities below is $185.94 on a per capita basis placed on a one-penny equivalent. The median is $169.82 on the same basis.
Yes, there are some wide variances. And without a doubt the main consumer-driven sources make a difference. However, don’t overlook that some of the above-average results are coming from cities with a large portion of business- driven transactions. Remember that the actual correct label is not just Sales Taxes; it is Sales & Use Taxes.
The bottom line is that you need both to have a healthy income stream for both Sales Taxes and Property Taxes. In all cases, realize that there is just so much that can be squeezed out of the consumer. And when squeezed too much (credit cards, HELOCs), a painful recoil is just a matter of time. Before you celebrate that a new Kroger has just opened, realize that you might be seeing an equivalent size grocery store closing within a couple of years. You might be just seeing a zero-sum situation except now you have to figure out what to do with an empty grocery store.
Where did I get the Consumer/Business allocation data? Actually, from two places. Similar but different. The first review was from the top level categories as compiled by exact information I have from over 25 cities of all sizes (total population of about 3.5 million in population and with collections of about $872 million in the last year) across the state based on NAICS codes that I have cleaned up. By cleaned up, I mean that many of the codes used by the State are in error. Apple Stores, for instance are classified as Manufacturing vs Retail.
A summary of the scrubbed data is in the table below. To no surprise, the dominant consumer categories are on top. However, you might be surprised at the level of sales tax that comes from Wholesale and Manufacturing and others.

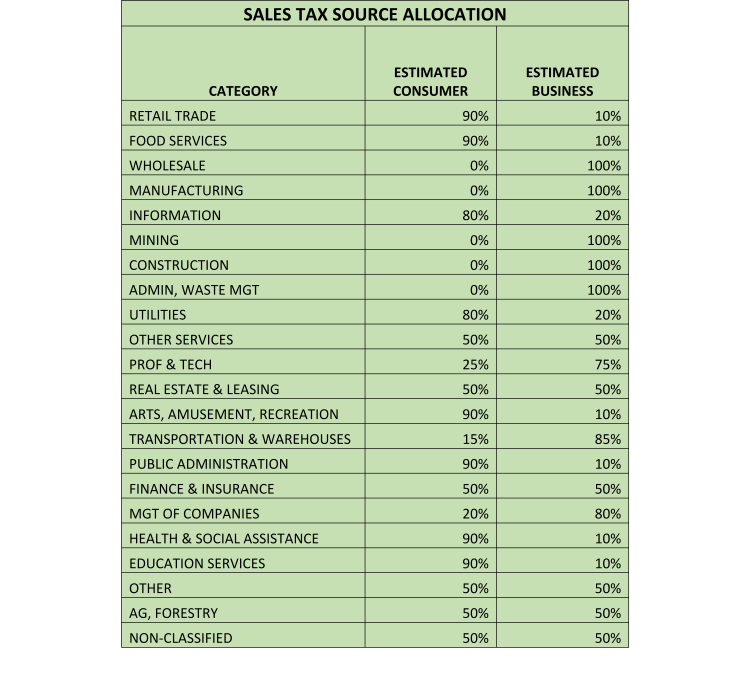
Second, I took each of the cities in my first table and allocated into Consumer vs Businesses groups based on data that can be obtained from the state for all cities and then used my judgment to allocate. It is not scrubbed, but the accuracy should be sufficient to make a meaningful comparison. My allocations are in the table below. No doubt you and I might allocate the Categories a little differently. However, this is the best I can do with the public data I have.
Conclusion.
It seems pretty obvious to me that many cities may be chasing the wrong things for sales tax purposes. It is acknowledged that I am focused only on sales taxes and not the production of property taxes nor on the number pf pure jobs and the pay levels for jobs. I can’t resist being Captain Obvious here by saying go for everything that helps provide a healthy balance in your revenue base.
However, now that Amazon and most of the prominent companies do in fact collect sales taxes and remit based on the city from which the order is placed, the potential for a city to get a substantial amount of retail sales taxes whether you have a business located in your jurisdiction has changed in your favor if you care to have your citizens’ money out of pocket coming back to their home city.
Don’t overlook the other Categories that are likely to generate a substantial amount of revenue and actually be more stable over time. LFM
