[Note: this blog has been updated to correct an error in the table and also to expand the table to be more informative with the breakdowns between cities, counties and school districts. The overall message is generally the same, but a few specific comments have been updated. LFM]
It will be best if you read yesterday’s blog before delving into today’s information.
Introduction.
Sometimes it can be dangerous to start comparing one local government to another. Part of the reason is that no single piece of data can tell a complete story. The other part is a fairly compelling argument that you must understand a lot about all of the cities in the comparison. There always will be outliers. At the same time, you will tend to see norms forming as certain ratios begin to cluster. And it is the ratios that are absolutely necessary to see. Ratios are the equalizers, or as close as we can make the data reveal a story.
First, you must select relatively meaningful entities to compare. Two common criteria are size and proximity. Below I have compared eight cities using those guidelines. Four are very close in size regarding population. Plano is included due to proximity to McKinney. I might have omitted Lewisville and even Denton except they are close in size, and Denton is a county seat city. Taken together, they perhaps form a nice U-shaped, contiguous configuration that starts and ends with McKinney and Denton in alignment with Hwy 380 to complete the horseshoe.
Building on yesterday’s blog, we have now enhanced our knowledge base considerably. I intentionally wanted you to focus on just the underlying approach and to be hungry to see how McKinney compares with a meaningful sample as presented today.
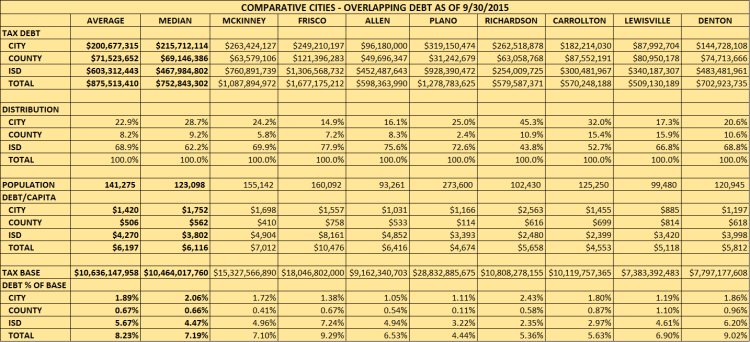
The absolute dollars are interesting but the least helpful in comparisons until you view the data on some common basis such as the percentage distribution. The average/median is 22.9/28.7% for the cities, 8.2/9.2% for county related and 68.9/62.2% for school districts. To no surprise after learning about the domination of ISDs yesterday, McKinney is well above the average and median. But let’s look deeper.
On a Per Capita basis, McKinney is quite high at $7,102 second only to Frisco with $10,476. Plano is the outlier on the lower end of the spectrum.
On the other key metric, Debt as a % of Taxable Values, McKinney is the third highest, with Frisco and Denton quite a bit higher.
So, What Are Our Takeaways?
There’s actually quite a few.
- We have confirmed that the school districts dominate in debt in just about every comparison.
- We have shown where McKinney is significanly higher than most of the cities we might use for comparison purposes in an effort to establish a “norm.”
- As a burden on city taxpayers, McKinney’s load due to ISDs (McKinney ISD, Frisco ISD predominately), is noteworthy.
- It is possible that we have spotted a cost differential with Frisco ISD’s policy of more but smaller high schools versus Allen ISD’s single high school. Not sure, more digging required to explain any outlier. What we also don’t know is the school building unused capacity for any of the school districts.
- We may have also spotted a high % of the tax base for debt in Denton due to the combination of so much non-taxable property with two large universities as well as county facilities. Again, validation requires some digging.
The Bigger Hidden Story.
Even well-managed city cannot control the other local governmental entities. Also, in many cases, counties, cities and school districts don’t talk to each other any more than they have to. In fact, many overlapping entities stay at odds with each other. Even though they serve the same taxpayers.
This friction becomes obvious to people like bond rating agencies having to evaluate each entity in light of one taxpayer and the vast number of bond holders. If the bond rating agencies and the citizens could huddle in one spot and deal with this one question, what do you think the outcome would be?
The Question: what could be done regarding debt and tax rates that would be the best for the citizens and the bondholders regarding affordability, ability to pay and willngness to pay?
The Possible Answer: Develop a policy that sets some parameters so that we can see the picture as a whole. For debt, the amount cannot exceed a total of $________ per capita with no more than $____ going to the county, $______ going to the city and $______ going to the school district(s).
Can you see how that is not so hard to do when you put comparative data in front of intelligent people willing to serve the people? Financial policies can be formulated, adopted and then revisited annually to affirm a gyroscope is in place to assure responsibleness. Can you imagine a set of policies everybody can articulate?
Conclusion.
Okay, okay, climb back over your pew and sit down. Even the bond rating agencies don’t like caps that could threaten the ability to repay the bond holders and to disrupt the operations of the local governments. I’m just trying to convey that more and more attention is being given to data-driven decisions. There is a maximum limit out there somewhere. Some say there is room to go. Others say were are there right now. Yet others say we have passed the limit. Can you put a number on it? I can. And you can, too.
Here is what we know. We (public officials and citizens) either self-police or else we risk somebody imposing a lid on us. In fact, did you know there is a traveling senate committee going around the state armed with data they are misusing to basically be prepared to stifle local governments’ ability to decide? We have prominent state officials elected on the promise they would try to eliminate property taxes? They had much rather “clean up” local government than to face their own egregious mishandling funds at the state level.
But heed the warning. Even today another story came out about Garland ISD missing the cost of a $20 million natatorium the voters approved by $10 million!
We are violating the principle of taking care of the basics and, if possible, do a few frilly things. In fact, the optional things that allow an elected official’s name on a building plaque are coming ahead of the crumbling streets and school buildings in many cases. More on that topic coming up. LFM
