One always has to remember that you can drown in a pond that only averages being 6-inches deep. I’ll get back to you on that one.
For the most part, local governments (cities, counties, transit authorities and special districts) take advantage of the maximum sales tax rate of 2-cents. That amounts to just over $8 billion each year. The state collects their 6.25%, so it is easy to see how significant this revenue source is in Texas. They also collect on auto and boat sales while the locals get none of that slice. Sales taxes are one of the major ways we keep from having an income tax in Texas. It is usually either the number one or number two largest revenue sources for the cities’ General Fund, often trading places with Property Taxes. Sales taxes are the Property Tax Rate Equivalent of about $0.35-$0.45.
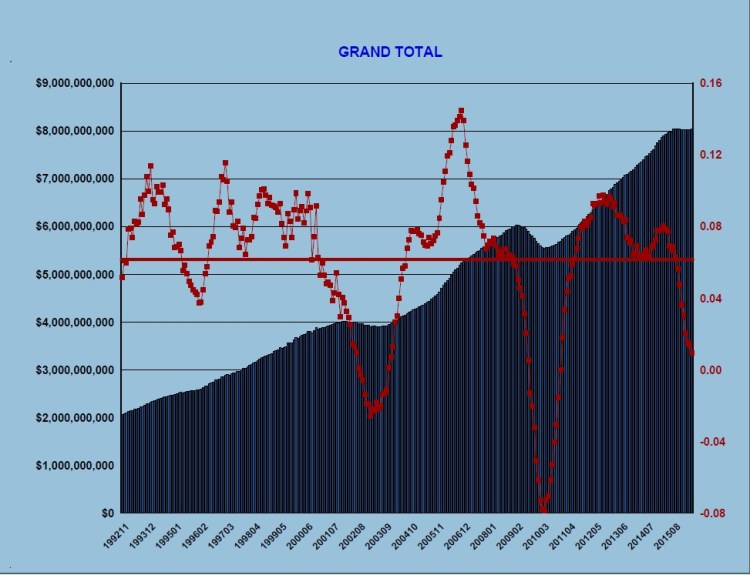
When you look at sales tax data that is seasonal, while also being tied to the economic cycles (two different factors), it is hard to make sense of it unless you view the data on a Rolling 12-Month basis (R12). That way you are always looking at a year’s worth of data. As you can see in the chart below, the trend has always been to the upside except temporarily during recessions. Texas is not immune from hurting badly when the consumers (70% of the economy) decide to slow down their spending, willingly or unwillingly. There is also a significant amount of business-to-business (B2B) sales and use taxes that make up this important revenue base.
Interestingly, you can use this data to identify the exact month that it was clear to the chart reader that we were entering into the Dot Com recession as well as the Great Recession. We can also see the exact month we had a confirmed bottom. The depth and length of the recessions and the rate of the recoveries are also critical to understand. Part of the understanding of recessions is simple: they happen! Economic cycles are treated as an injury that demands all kinds of rescue efforts and major surgery. Hence the Federal Reserve as well as the Political Machinery jump into action and sometimes do dumb things to prevent a natural economic cycle from playing out as it should.
As a whole, the local governments in Texas have collected $8,040,691,221 in sales taxes for the 12 months ending May 2016. However, the amount collected for the 12 months ending May 2015 totals $7,966,819,038! That’s almost perfectly flat. In fact, we are in our 15th month (it really went flat in March 2015) of almost zero growth.
Even more revealing than the absolute dollars is the R12% growth rate, the red lines. This is a more sensitive indicator and announces a slowing and changing of a trend quicker than can be seen just looking at the blue dollar bars. There are several stories in the red lines. Since 1992, the average has been 6.14%. That is a very robust number that takes into consideration 1) population and business growth; 2) inflation; and 3) a “wealth/debt” factor. We are a relatively wealthy state, but we have also been as foolish as the rest of the nation with consumers spending more than we have via HELOC loans, credit cards and any other kind of money we could borrow.
As a rule, as the historical data proves it, any time the R12% growth rate has even approached 9-10%, a recoil soon follows. The recoils can be ugly and as deep as the preceding rises were steep. This makes sense in that the third factor listed above cannot be sustained for a long period of time without bursting. If the consumer lived with their means, there would not be as many booms and busts. Also, full-employment has the unwanted and unsustainable pay increase pressures that breakdown at some point.
So, where are we? The most recent R12% peak was at 8.02% in March 2015. If you are studying the chart below carefully, you should be asking about the previous recent spike that declined to the average and then rose again before the current roller-coaster dip started. The answer is that we were recovering from the Great Recession just fine, peaked and then were pulling back when something happened. Gasoline prices plunged giving the consumer a few extra bucks to spend. Wal-Mart keeps metrics and can actually tell when tax laws change or some event gives or takes away $20 per week of people’s spending money.
But in Texas, cheap oil and gasoline is a double-edged sword. Hence, the downward pressure of the economy overwhelmed the state. An extra $20 per week for the majority can’t offset $30,000 to $100,000 jobs being lost by the thousands. The interconnectedness of our state started showing up in a big way 15 months ago.
The R12% growth rate peaked and has declined in 14 of the 15 past months. That statistic dropped to a brutal low of +0.93% in May 2016. It is possible that it could stay near-flat for months, but there would be every reason to believe we could go negative in the R12 and the R12% as early as next month.Yes, it is possible the sales tax levels could rise again. But I’ll let you make the call.
Today there were several stories in the news about some of the major bellwether retail companies suffering big declines. The job market has been softening for several months at both the national and state level. Fitch came out today with a report that housing prices in the North Texas were 15-20% too high. My goodness, we have learned absolutely zero from the causes of the Great Recession!
So if this is statewide information, how are individual regions, sub-regions and cities doing? Well, that’s why the 6-inch drowning comment was made in the introduction. While the state as a whole is grinding to a stop, some cities are getting killed. Mostly in the oil patches and where local economies heavily support the oil & gas industries.
See the TML Regional Map following the chart. Most of the regions have been falling steeply for months and have been negative for at least a few months. As of May 2016, these are the following R12% results:
TML Region 02: -2.10%. (Amarillo area)
TML Region 03: +0.65%. (Lubbock area)
TML Region 04:-5.90%. (Midland-Odessa area)
TML Region 05: -1.58%. (Wichita Falls area)
TML Region 06: +3.88%. (Abilene area)
TML Region 07: +0.40%. (San Antonio area)
TML Region 08: +12.28%. (Fort Worth area)
TML Region 09: +4.53%. (Waco area)
TML Region 10: +7.24%. (Austin area)
TML Region 11: -2.97%. (Corpus Christi area)
TML Region 12: +4.62%. (Rio Grande Valley area)
TML Region 13: +17.96%. (Dallas area)
TML Region 14: +18.29%. (Houston area)
TML Region 15: +8.13%. (Tyler-Longview area)
TML Region 16: -1.39%. (Beaumont area)
Yes, North Texas and a few other regions of the state don’t know what everybody is talking about regarding slow growth. There have been some huge corporate moves in motion that don’t stop until done. And remember that these TML Regions are quite large. Region 14 is doing well, but Houst0n itself is down -2.71%.
Here is what I do every month, and I invite you to dive in and see for yourself. First, look at the state as a whole. Then look at the 15 Regions. Appreciate the economic diversity across the state. Then look at any of the 1,600+ individual entities.
You can train your eyes fairly quickly to just look at the shapes and directions. Then with the roll of the wheel on your mouse, you can spend just a few seconds on each chart to size up the magnitude and direction of sales taxes. A dozen people looking at 50 charts are highly likely to arrive at the same conclusion regarding the overall direction and health of this key metric.
Appreciate the fact that sales taxes are just about as early of a warning system as we could have. The sales tax checks we received last Friday are for the actual business activity through March 31, 2016. Imagine that. Buy an iPhone on March 31, and the sales tax is in the local government’s bank account about 40 days later. That is dang near real time.
The collection of charts can be found at this link. It is a large file that may take a few minutes to download. I can download on my iphone and iPad, but it is best downloaded to your laptop or desktop. For those of us who like real data in addition to charts, a recap of the last 25 months can be found at this location.
Let me know if you have any questions. LFM
You can go to http://www.tml.org/regions to see the exact counties in each Region.
