Mexico’s Cartel System: What Just Happened — and What Comes Next
A collaboration between Lewis McLain & AI
I. The Cartel Landscape: Not a Pyramid, but a Web
Mexico’s cartel world is not one giant mafia with a single throne. It’s a shifting network of powerful criminal organizations, splinter groups, regional franchises, and temporary alliances.
The two most dominant forces in recent years:
🔵 Sinaloa Cartel


- Deep international smuggling infrastructure
- Major fentanyl and meth production
- Historically associated with Joaquín “El Chapo” Guzmán
- Currently fragmented into powerful factions
Sinaloa built a reputation for operational sophistication. Less theatrical than some rivals — but massively global.
🔥 Jalisco New Generation Cartel (CJNG)

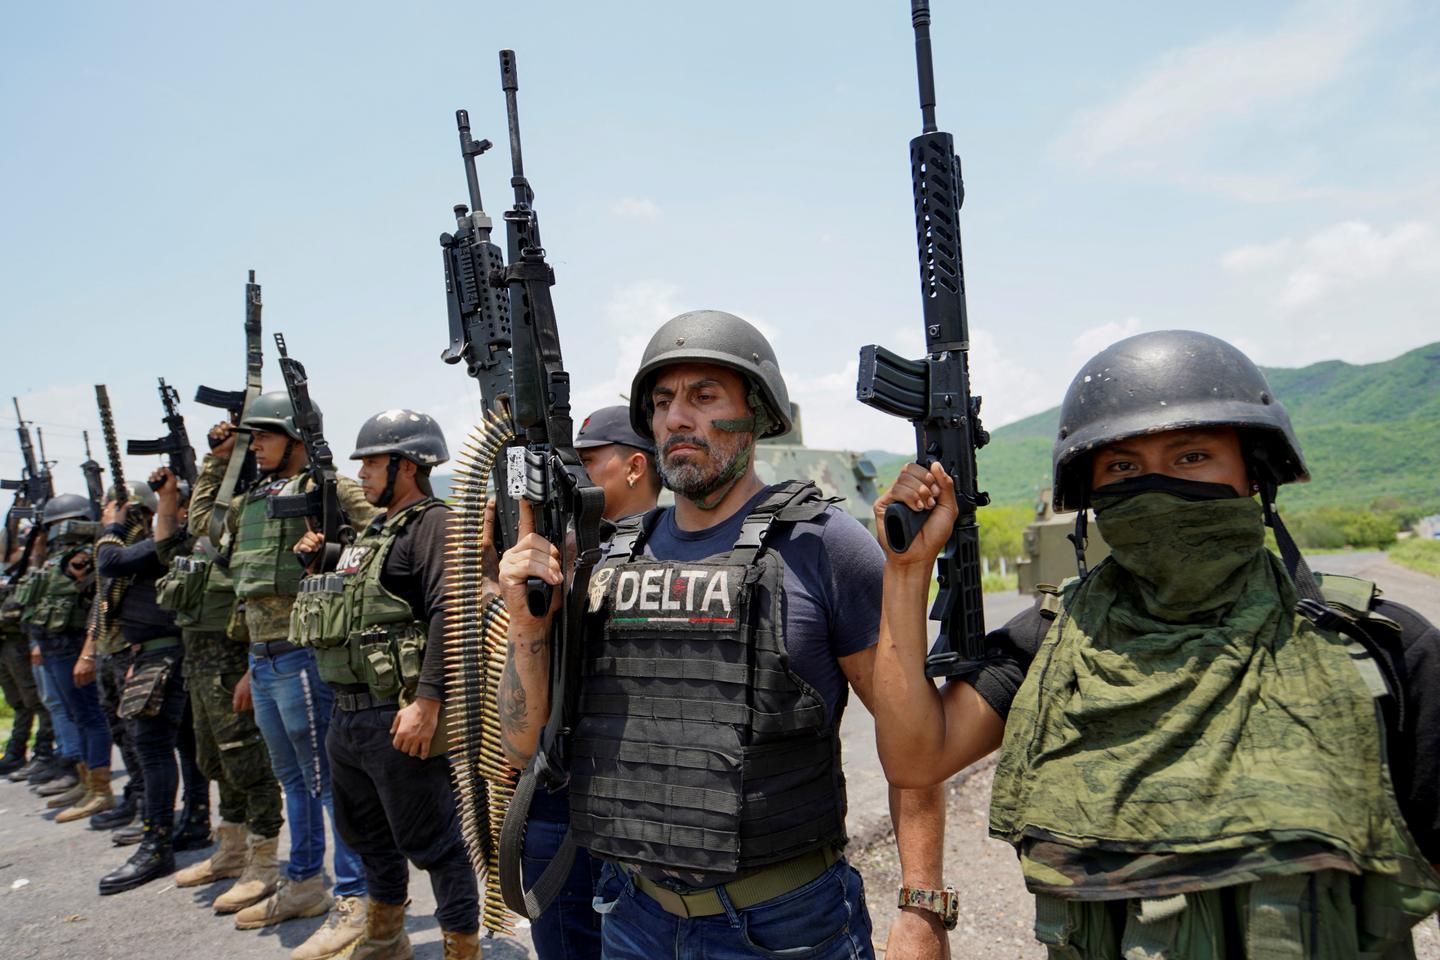
- Rapid expansion since ~2010
- Militarized posture
- Heavy weapons and armored convoys
- Led until now by Nemesio Oseguera Cervantes (“El Mencho”)
CJNG grew aggressively, often clashing directly with Sinaloa and absorbing weaker groups.
Other significant players include:
- Gulf Cartel
- Los Zetas (and its remnants)
- Beltrán-Leyva Organization
- La Familia Michoacana and splinters
But the modern battlefield has increasingly been Sinaloa vs. CJNG.
II. The Immediate Story: El Mencho Reportedly Killed
Mexico’s military reports that El Mencho was killed in a targeted operation in Jalisco.
If confirmed and sustained (details often evolve in cartel cases), this is one of the most consequential blows to a Mexican criminal organization in over a decade.
What follows such events historically?
- Internal succession battles
- Splinter factions breaking off
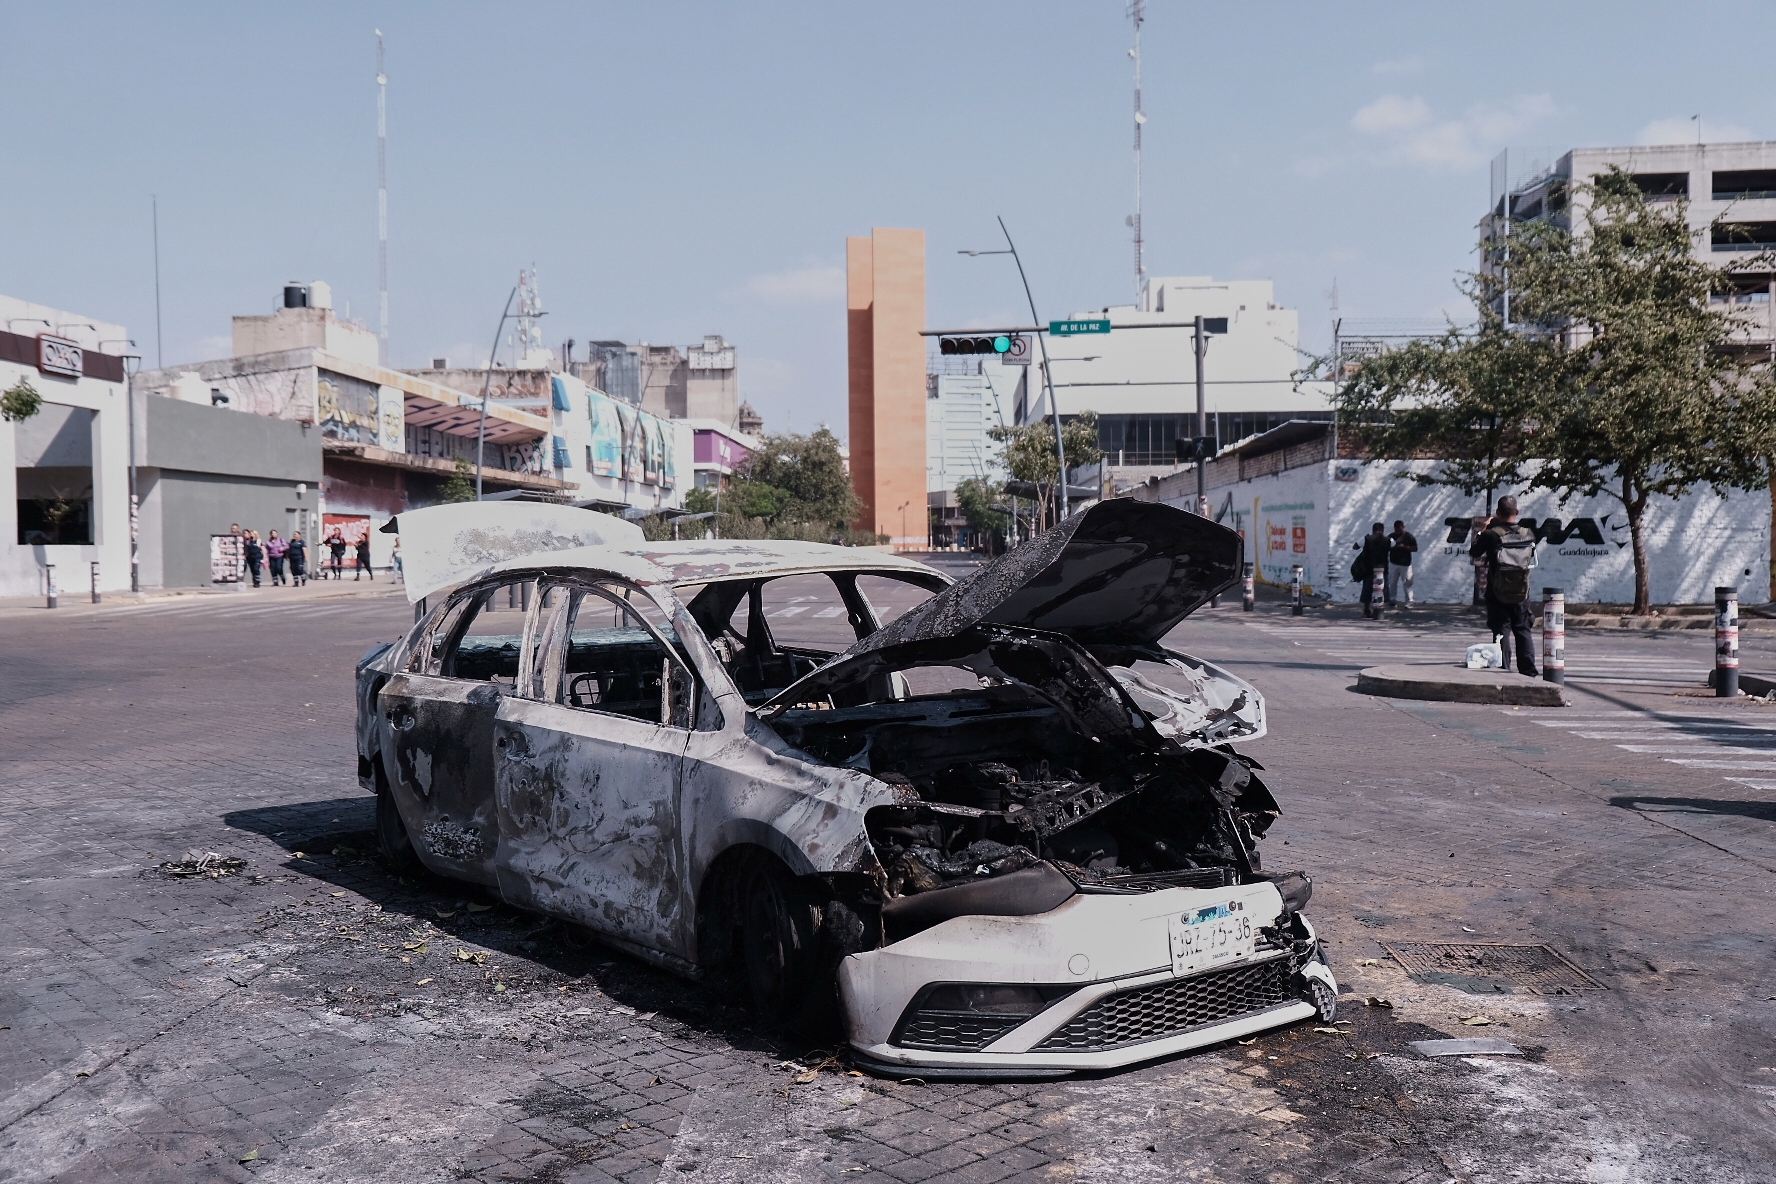
- Short-term violence spikes
- Rival cartels testing territory
The removal of a kingpin rarely ends a cartel. It destabilizes it.
Think less “collapse” and more “fragmentation under pressure.”
III. The Rumored “Agreement”: Kill Each Other, Leave Civilians Alone?
After events like this, a familiar story resurfaces:
Cartels are allowed to fight each other as long as they avoid harming citizens and especially tourists.
Let’s analyze that soberly.
Is there a formal agreement?
No verified evidence supports a nationwide, formal agreement between the Mexican federal government and cartels allowing violence under conditions.
Such a policy would amount to institutionalized impunity. No credible documentation supports that claim.
Is there informal tolerance in some regions?
Corruption absolutely exists at local levels. In certain historical periods — particularly before the mid-2000s — analysts describe something closer to “managed containment”:
- Violence discouraged if it disrupted economic stability
- Trafficking routes quietly tolerated
- Public spectacle minimized
But that was not a moral contract. It was corruption plus centralized political control.
When political centralization weakened, so did that equilibrium.
Why does the tourist-protection idea persist?
Economics.
Cartels are businesses with guns. Tourism generates billions. Killing tourists invites:
- Federal troop deployments
- International pressure
- Economic backlash
- Media spotlight
So many groups avoid unnecessary attention in resort zones — not because of ethics, but incentives.
Yet civilians absolutely die every year in large numbers:
- Extortion victims
- Journalists
- Politicians
- Migrants
- Bystanders in crossfire
Homicide data alone disproves the idea of a functioning “civilian shield” agreement.
Organized crime sometimes acts rationally. It does not act morally.
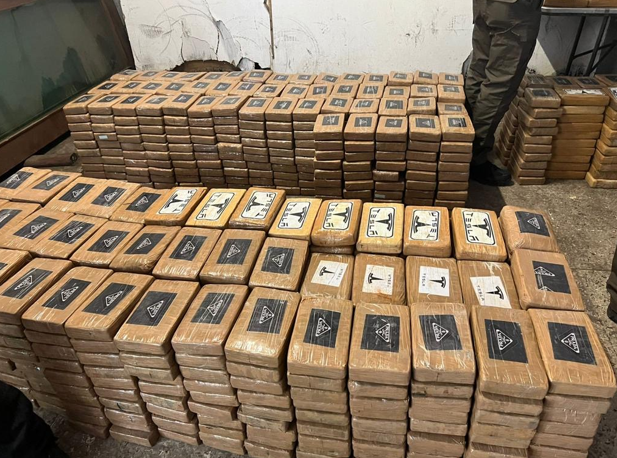
IV. Why Fentanyl Changed Everything
One reason the cartel landscape has grown more violent is the fentanyl economy.
Fentanyl is:
- Synthetic
- Extremely cheap to produce
- Highly profitable
- Compact and easy to transport
Unlike plant-based drugs (marijuana, heroin), fentanyl production depends more on chemical supply chains than farmland.
That lowers entry barriers and increases fragmentation.
More actors can compete.
More actors compete → more turf wars.
V. Where This Is Heading
El Mencho’s death, if solidly confirmed, likely produces one of four trajectories:
1️⃣ CJNG Consolidates Under a Successor
A lieutenant quickly stabilizes control. Violence spikes briefly, then normalizes.
2️⃣ Fragmentation
CJNG splits into regional factions fighting each other and Sinaloa. Violence increases.
3️⃣ Sinaloa Expansion
Sinaloa factions exploit instability to absorb territory.
4️⃣ Federal Escalation
Mexico increases military deployments, temporarily suppressing overt conflict.
History suggests fragmentation is most common after a kingpin removal.
And fragmentation increases unpredictability.
VI. The Bigger Structural Issue
Cartels exist at the intersection of:
- U.S. drug demand
- Weak local governance in some regions
- Corruption vulnerabilities
- Enormous profit margins
Removing leaders addresses symptoms. It rarely addresses incentives.
Until the demand side shifts, the profit engine keeps running.
This is not a story of villains in isolation. It is a story of transnational economics, political systems, and power vacuums.
The Uncomfortable Prediction
Short term:
Expect turbulence in Jalisco and contested corridors.
Medium term:
Watch for internal CJNG fractures or aggressive Sinaloa positioning.
Long term:
Unless structural incentives change, the system adapts. It always has.
Criminal ecosystems evolve the way markets evolve.
And markets — legal or illegal — follow incentives.


You must be logged in to post a comment.