Research by AI; Guided by Questions from Lewis McLain
I. Origins & Etymology
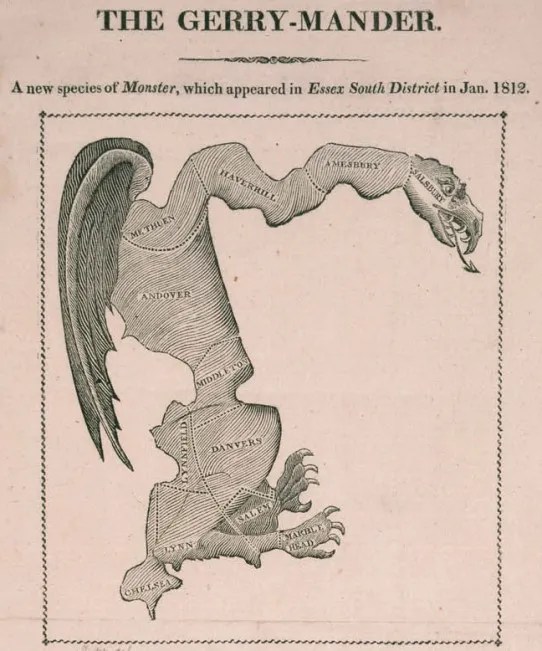
Gerrymandering derives from early 19th-century Massachusetts: In 1812, Governor Elbridge Gerry approved a partisan redistricting plan so oddly shaped it resembled a salamander. A Boston Gazette cartoon coined the term “Gerry‑mander,” merging his name with the creature’s form.
At its core, gerrymandering refers to drawing district lines to benefit particular political interests—resulting in bizarre, contorted districts. While most people associate it with partisan trickery, the truth is more layered: racial bias and partisan bias often function in tandem.
- Racial gerrymandering dilutes or overconcentrates minority voters, violating the Voting Rights Act of 1965 or the Equal Protection Clause of the 14th Amendment.
- Partisan gerrymandering distorts maps to entrench the ruling party, regardless of overall vote share.
Though the two tactics are frequently inseparable in practice, the United States Supreme Court treats them differently:
Partisan gerrymandering is considered a nonjusticiable political question, outside the reach of federal courts, as established in Rucho v. Common Cause (2019).
Racial gerrymandering is subject to strict judicial scrutiny.
II. Why & How Gerrymandering Happens
Redistricting, conducted every ten years after each census, is meant to reflect population changes. However, when controlled by legislators, it often becomes a tool for cementing political advantage through two tactics:
- Cracking divides opposing-group voters—often minorities or supporters of another party—across several districts so they cannot form a majority.
- Packing concentrates those voters into a few districts where they win overwhelmingly, wasting their votes elsewhere.
These techniques are the foundational tools of both racial and partisan gerrymandering.
While all states redraw district lines, gerrymandering intensity varies—some use independent commissions (e.g., Arizona) to constrain manipulation, while others are deeply partisan.
III. Do All 50 States Gerrymander?
Technically, every state adjusts its electoral maps, but not all do so with partisan intent. Some, like Arizona, employ independent commissions to limit political influence.
Recent trends point to a redistricting “arms race”: Texas enacted a mid-decade map boosting Republican advantage, triggering lawsuits over minority vote dilution. Meanwhile, California, New York, and Utah (the latter with a court-ordered redraw) exemplify ongoing tensions.
IV. Supreme Court & Landmark Cases
Foundational Jurisprudence
- Baker v. Carr (1962): Established that redistricting is justiciable under the Fourteenth Amendment’s Equal Protection Clause.
- Wesberry v. Sanders (1964) & Reynolds v. Sims (1964): Reinforced “one person, one vote.”
Racial Gerrymandering Cases
- Shaw v. Reno (1993): Race-based districts trigger strict scrutiny under Equal Protection.
- Shaw v. Hunt (1996): Reinforced that race-dominated design must be narrowly tailored.
- Miller v. Johnson (1995): Reaffirmed the unconstitutional nature of race-dominant districting.
Voting Rights Act Protections
- Allen v. Milligan (2023): Required Alabama to add a second Black-majority district under Section 2 of the VRA.
- Louisiana v. Callais (2025 Term): Now challenging whether creating race-conscious districts—even to prevent minority dilution—is constitutional. Oral arguments are scheduled for October 2025.
Partisan Gerrymandering Jurisprudence
- Rucho v. Common Cause (2019): Declared partisan gerrymandering a nonjusticiable political question, preventing federal courts from intervening.
State-Level Reform & Independent Commissions
- Arizona State Legislature v. Arizona Independent Redistricting Commission (2015): Upheld the right of voters to empower independent commissions for map-drawing under the Elections Clause.
V. Supreme Court Rejections of Partisan Gerrymandering Claims
The Supreme Court has consistently declined to address partisan gerrymandering claims:
- Rucho v. Common Cause (2019): Held such cases are outside federal jurisdiction.
- Lamone v. Benisek (2019): Declined to intervene in a Maryland case, affirming Rucho.
- Gill v. Whitford (2018): Dismissed due to lack of standing, without addressing the merits.
- Benisek v. Lamone: Another Maryland case rejected on procedural grounds.
- Gaffney v. Cummings (1973): Upheld a Connecticut map, issuing that minor political imbalances don’t violate Equal Protection.
VI. If Courts Treated Partisan Bias Like Racial Bias
In current jurisprudence, racial gerrymandering is justiciable—courts routinely strike down districts when race is used as the predominant factor without sufficient justification. But in Rucho v. Common Cause, the Supreme Court held that federal courts cannot hear claims of partisan gerrymandering, declaring them political questions beyond their reach.
But what if that changed? If courts treated partisan bias the same way they treat racial bias—with strict scrutiny and intervention—many current maps would likely be invalidated. This shift in doctrine could dramatically rebalance political power in Congress.
Several prominent analyses help estimate the scale of potential change:
- The Brennan Center (2024) found that current maps cost Democrats approximately 16 seats due to partisan gerrymandering.
- A Center for American Progress (2012–2016) report found that up to 59 House seats were skewed in favor of Republicans through unfair redistricting.
- A FiveThirtyEight simulation concluded that if all 50 states gerrymandered to their fullest extent, Republicans would gain roughly 30–35 extra seats.
In sum, correcting partisan bias through judicial oversight would likely flip between 16 and 59 seats from Republicans to Democrats, altering or even reversing the current House majority.
VII. State-by-State Breakdown: Where the Seats Would Shift
To understand how partisan gerrymandering distorts representation, it helps to look at specific states. Below are groupings based on how maps are drawn, their partisan bias, and expected seat shifts if redrawn under neutral or court-approved standards.
🟢 Independent Commissions (Low/Neutral Bias)
These states use nonpartisan or bipartisan commissions, reducing opportunities for political manipulation:
- California: No bias; citizen-led process
- Colorado: Competitive and balanced districts
- Michigan: Commission adopted after 2018 reform
- Arizona: Minor Democratic lean, but publicly accountable process
🟡 Moderate or Mixed Bias
States with recent court-drawn maps or commissions with imperfect balance:
- Pennsylvania: Court intervention restored balance
- Virginia: Map drawn after commission impasse
- New Jersey: Tie-breaker rules favor incumbents; moderate Democratic lean
🔴 Extreme Republican Gerrymanders
These states are the largest contributors to Republican overrepresentation:
- Texas: +6 to +9 seats due to cracking Latino and urban communities
- Florida: +5 to +6 seats after DeSantis overturned a fairer court-approved map
- Ohio, North Carolina, Wisconsin: Legislatures engineered consistent GOP advantages despite roughly even statewide vote shares
- Georgia, Louisiana, Tennessee: Minority dilution and urban fracturing yield additional GOP gains
🔵 Extreme Democratic Gerrymanders
Though fewer, some Democratic-controlled states also engage in biased line-drawing:
- Illinois and Maryland each net 1–2 seats by concentrating rural GOP voters or diluting their influence
This breakdown illustrates how partisan bias—especially in large, fast-growing, or swing states—can significantly shift congressional outcomes.
VIII. Independent Commissions vs. Legislative Control
When comparing states that use independent commissions to those that rely on legislature-controlled maps, a clear pattern emerges:
- Independent commissions result in fairer, more proportional representation, with greater competitiveness and fewer legal challenges.
- Legislature-led states, especially those with single-party dominance, tend to produce maps with significant bias, often preserving or expanding partisan advantage regardless of voter shifts.
This contrast reinforces the conclusion that reform through commissions, transparency, and public engagement is the most viable path to redistricting fairness.
IX. Summary of Projected Seat Shifts
These projections combine data from simulations, court filings, and voting behavior models. The following states are the most affected by partisan bias:
- Texas: 6–9 seats to Democrats
- Florida: 5–6 seats
- Ohio: 3–4 seats
- North Carolina: 2–3 seats
- Wisconsin: 2 seats
- Georgia: 1–2 seats
- Louisiana: 1 seat (restoring a Black-majority district)
- Tennessee: 1 seat
- Illinois and Maryland: 2–3 seats might flip to Republicans under a neutral standard
Nationwide impact: Correcting partisan bias through judicial scrutiny could flip between 16 and 59 seats. Such a shift would not only affect House control but also committee leadership, federal legislation, and the national policy agenda.ould shift—enough to reverse the House majority and shape national policy for a decade.
X. Conclusion: One Standard, Two Outcomes
America currently applies two legal standards to what is often one strategy:
- When race is the explicit factor in redistricting, courts scrutinize and often strike down maps.
- When race is used as a proxy for party advantage, courts defer to the political process.
The result is a system where millions of voters—especially those in diverse, urban, or competitive regions—are systematically underrepresented, while entrenched state governments shield themselves from competition.
If courts treated partisan gerrymandering with the same seriousness as racial gerrymandering, it would transform American representation and restore fairness to the democratic process.
Begging the Question
✅ 1. Clarify the Core Question
Should the distribution of seats in the U.S. House of Representatives roughly reflect the ratio of votes cast for each party in presidential elections (or other statewide totals)?
This involves a deeper question:
- Should representational fairness be tied to aggregate voter preference, or to district-level dynamics?
🧩 2. Define Evaluation Criteria
To weigh the pros and cons fairly, establish the principles or goals you care about. For example:
| Criterion | Explanation |
|---|---|
| Democratic Fairness | Does the system reflect the will of the people as expressed in their votes? |
| Constitutional Integrity | Does the idea respect the U.S. system of government and its legal framework? |
| Representation Quality | Does it allow local communities to elect candidates who reflect their specific interests? |
| Feasibility & Stability | Is it workable, and does it produce stable, trusted outcomes? |
| Manipulation Resistance | Does it reduce incentives or tools for gerrymandering? |
⚖️ 3. Weigh Pros and Cons Under Each Criterion
| Criterion | Pro-Alignment Argument | Anti-Alignment Argument |
|---|---|---|
| Democratic Fairness | Vote-seat alignment ensures majority rule and legitimacy | Split-ticket voting and turnout variation mean alignment may misrepresent intent |
| Constitutional Integrity | Could guide mapmakers without requiring reform | The Constitution guarantees single-member districts, not proportionality |
| Representation Quality | Prevents distortions where 45% of voters get 20% of seats | House members serve local areas, not national party shares |
| Feasibility & Stability | Easy to measure; can inform fair redistricting practices | May encourage radical reforms or undermine federalism if applied rigidly |
| Manipulation Resistance | Presidential vote benchmarks expose gerrymandering | Could mask subtler forms of bias not captured in statewide totals |
🧠 4. Synthesize: Which Principles Matter Most?
Ask:
- Is vote-seat proportionality a core democratic value?
- Or is local, district-based representation more important, even if it causes some mismatch?
If your priority is majoritarian fairness and anti-manipulation, you may favor alignment.
If your priority is constitutional tradition, localism, or district-level nuance, you may favor flexibility.
🧭 5. Conclusion: Nuanced Recommendation
You could logically conclude:
Presidential vote ratios should not rigidly dictate House representation, but they should serve as a diagnostic benchmark. When vote-share and seat-share diverge significantly, it often signals manipulation—not natural variation. Therefore, they should be used to identify potential gerrymanders, but not as a constitutional requirement.
Another Major Question: The Independence of Commissions?
Independent redistricting commissions are designed to reduce partisan influence—but they’re not immune to bias or manipulation. Here are the key ways that even these commissions can be bent to political advantage:
⚠️ 1. Commission Composition Can Be Politically Engineered
- Who selects the commissioners? Often, political leaders (e.g., legislative leaders or governors) nominate or approve members.
- This can lead to:
- “Bipartisan collusion”: Democrats and Republicans may agree to protect incumbents rather than ensure fairness.
- Hidden partisanship: Individuals labeled as “independent” may still have partisan loyalties or donor histories.
Example:
In New Jersey, the bipartisan commission includes a tie-breaking member chosen by both parties—often leading to deals that entrench both sides’ incumbents rather than create competitive maps.
⚠️ 2. Data and Criteria Can Be Manipulated
- Commissioners choose how to interpret criteria like “compactness,” “communities of interest,” or “competitiveness.”
- If partisan operatives influence data models, mapping software, or community testimony, the final map can reflect subtle bias.
Example:
In Arizona, although the commission is independent, critics argued that some early cycles were swayed by Republican-linked consultants who shaped how communities of interest were defined.
⚠️ 3. Deadlock or Commission Failure Can Default to Partisan Actors
- Some commissions require supermajority or bipartisan approval. If they deadlock, the decision reverts to courts or legislatures, which reintroduces partisanship.
Example:
In Virginia, a bipartisan commission deadlocked in 2021. The state supreme court appointed two special masters, both tied to past partisan mapmakers, prompting concerns over impartiality.
⚠️ 4. Public Input Can Be Staged or Stacked
- Open hearings are meant to encourage civic participation, but parties can mobilize supporters to dominate public comments, creating the illusion of grassroots consensus.
Example:
In Michigan, activists warned that coordinated testimony from party-aligned groups overwhelmed independent perspectives, subtly shaping the map outcomes.
⚠️ 5. Reform Language Can Be Vague
- Some “independent commissions” are only advisory, with their proposals subject to legislative override.
- Even binding commissions may be poorly defined, allowing backdoor political influence through legal loopholes.
✅ Summary: Commissions Reduce Risk—Not Eliminate It
| Weakness | Description |
|---|---|
| Composition bias | Selection process favors party insiders |
| Data manipulation | Criteria interpreted to favor outcomes |
| Deadlocks & defaults | Process can revert to legislature/courts |
| Staged public input | Manufactured testimony shapes perceptions |
| Weak enforcement | “Independent” may lack legal authority |
Conclusion:
Independent commissions are generally more fair than legislature-controlled redistricting—but they are not foolproof. Ensuring true independence requires transparency, oversight, citizen engagement, and strict conflict-of-interest rules.
