I am approaching my ten-year anniversary of writing about a subject that causes me to feel like Captain Obvious speaking to the Country of Oblivious. Some of us are numbers people, some picture people and others word people. I like all three and try to use every tool to communicate. There are five charts below. Let me see if I can summarize them succinctly.
Chart I shows the US outstanding debt from the early 1980s through September 30, 2016. Think Presidents Reagan through Obama. We now owe $19,573,444,713,936.79 in debts. To place $19.6 trillion into a proper perspective, I have shown this mountain of debt on a per household basis and then adjusted for inflation. The load has risen from $33,017 to $164,695 per household for 4.99x over the relatively short chart period.
This does not include the present value of Social Security and Medicare, which have estimates of over $100 trillion according to the Dallas Federal Reserve. This does not include your personal debt, nor any state, county, city, ISD or special district debt, including the present value of retirement benefits.
Chart II looks like a portion of Texas. It’s the cumulative amount of debt attributable to operating deficits. Here is a recap (in $millions).
The Total Deficit as of 9/30/1980 $ 907,707.
Deficit Spending Since $11,822,278.
Debt Sub-total $12,729,985.
Debt Outstanding at 9/30/2016 $19,873,445.
Difference (Off Books???) $ 7,143,460.
Yes, the debt has soared. By every President and every sitting Congressional Member no matter the party in control since 1980. Chart II also shows the percentage of overspending on the disclosed operating budget. Right now we are at about 17.98% and have averaged about 20% over the chart period. One way this metric could be interpreted is to say that revenues would need to be raised or expenditures cut (or a combination thereof) by 20% to just breakeven on the disclosed budget and probably about another 10-15% to cover the Off-Books spending. That might stop debt from growing but not pay off a penny of the $19 trillion. Raise your hand if you believe either will happen.
I’m pretty sure my 8th grade granddaughter is working story problems more difficult than this one to figure out where things are heading.
Charts III and IV give us an idea about how we are pushing the limits on what we can expect to be milked from the overall potential revenue base. All you have to know is that every dollar of our annual Gross National Product totals about $19 trillion. And the US government revenue base is $3.3 trillion. Logic would say that if the federal government is taking in 17.20% of the GNP, that’s big no matter how you measure it. Again, layer the state, county, ISDs and other special districts and … you just have to appreciate reasonable limits.
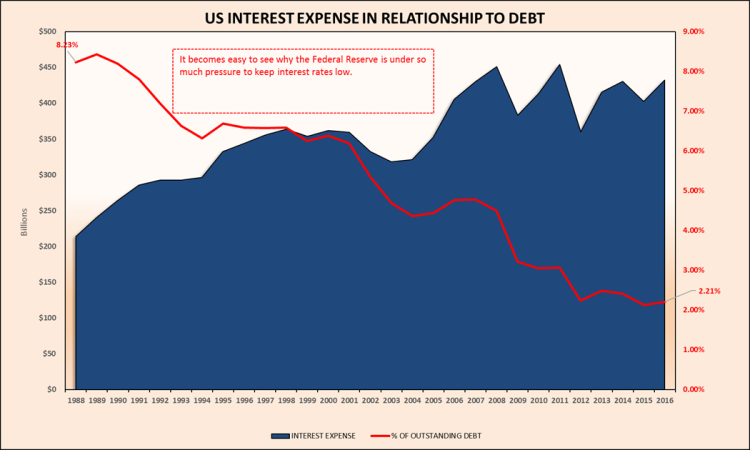
Chart V is just one of the fabricated and dangerous aspects to the reason we haven’t collapsed since I started predicting so ten years ago. The inflation and interest rates can be manipulated by the Federal Reserve. It has now been so long that many of the newer families and employees don’t realize what has happened. To control rising Social Security costs and to lower the amount the US government pays on interest toward this staggering amount of debt, Chart V shines the light on the gimmick.
Interest rates on US Debt have been lowered from 8.23% in 1988 to 2.21% in 2016. The eye can figure out quite quickly the impact if we were dealing with true interest rates, rates that took real inflation and real risk into consideration. With an expenditure base of about $3.856 trillion, the interest expense of $0.433 trillion is about 11.22%. What would the 2016 disclosed budget operating deficit of about $0.588 trillion have looked like if interest costs were in the 5% range? Close to double. See the motivation our leaders have to manipulate the numbers?
There is another big issue here. Retired people hoping to make it on their 401k and Social Security benefits are getting shafted. The tendency at that age and stage is to be conservative and safe. And for the last several years that kind of thinking will earn retirees very close to zero. I never thought I would hear serious discussions and see real actions to drive interest rates below zero. But here we are.
To be fair, many Social Security recipients and almost all Medicare beneficiaries are receiving much more out of the system than they ever put into the system – another faulty math problem that has led to the big deficits and debt.
Conclusion.
The perfect storm is coming as it relates to the sustainability of gimmicks and outright massive spending to keep things afloat. One of the ways the Federal Government has taken advantage of low rates is to move to shorter term instruments. The problem with that is like having a 6-month mortgage instead of 15+ years. You and the lender come face to face frequently, always with the possibility that the lender doesn’t want to reinvest.
The lenders of the $19 trillion are first the government itself. The Social Security funds temporally on hand, for instance, have been used by the Federal Government to pay for operations. Those funds held by foreign countries are not a small part of the lender base. Yes, we are viewed as a safe haven, but that’s mostly because other countries are worse.
And isn’t that a sound footing to be on? Especially as we want it all, we want it now, and we want somebody else to pay for everything. Good luck, Country of Obvious. That arithmetic is eventually going to catch up with us! LFM
Chart I.
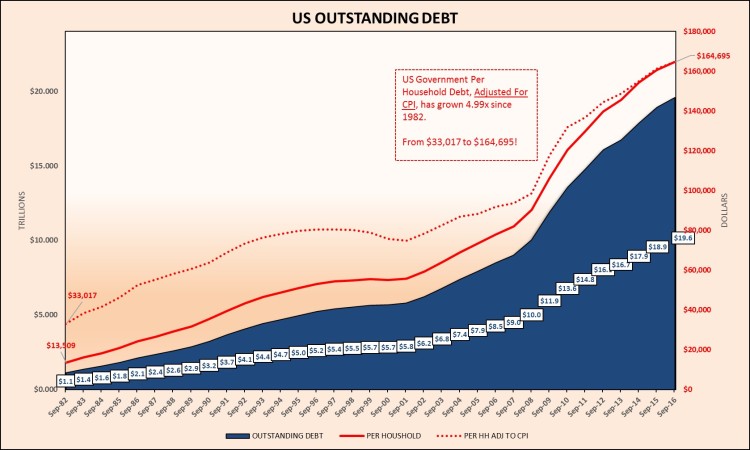
Chart II.
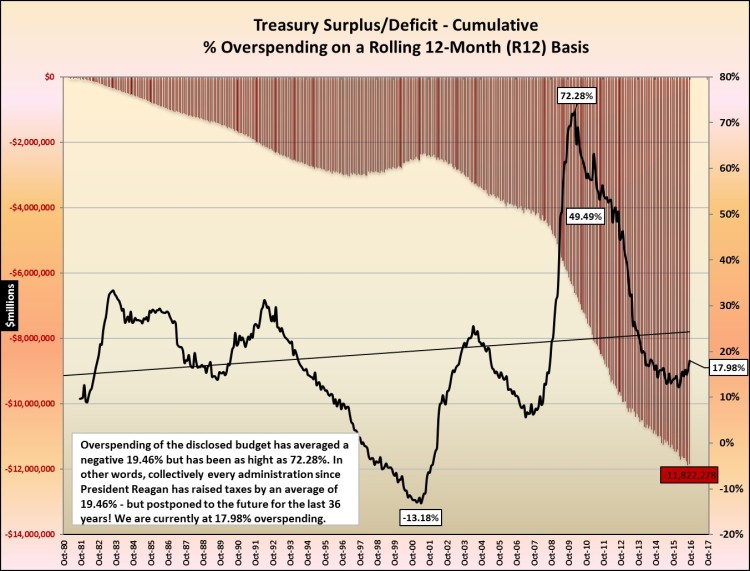
Chart III.
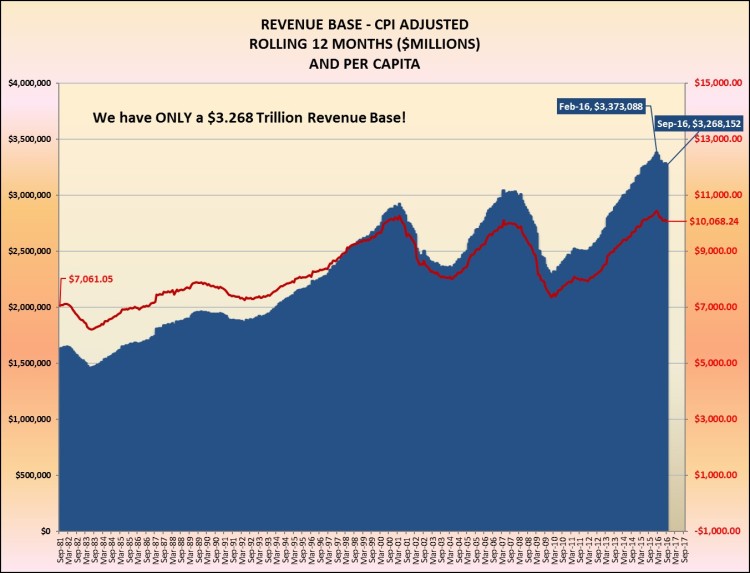
 Chart IV.
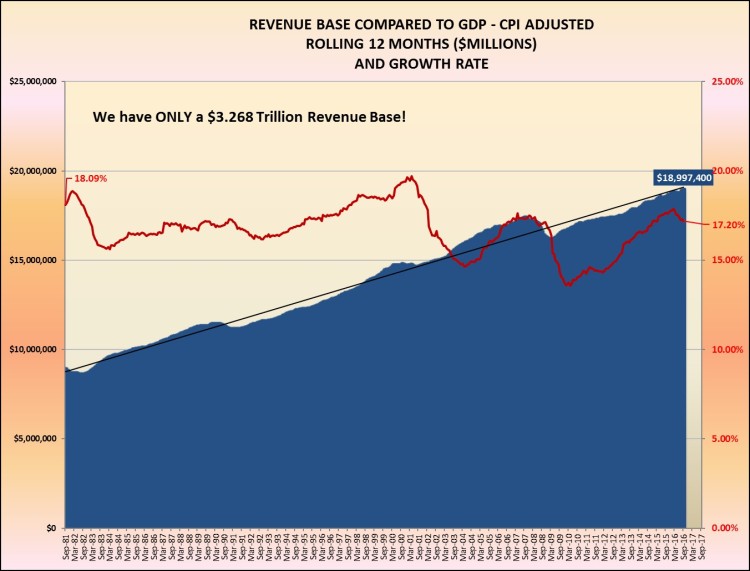
Chart V.